Finding WellMind
When you're already struggling with your mental health, the last thing you need is a confusing search experience. I set out to understand exactly where that experience breaks down, and why more research doesn't make it easier. Here's how mixed-methods rigor turned a complex human problem into actionable design direction.
Role
User Researcher
Timeline
10 weeks
Team
4 User Researchers
Organization
DePaul University (graduate project)
Role
User Researcher
Timeline
10 weeks
Team
4 User Researchers
Organization
DePaul University (graduate project)
Role
User Researcher
Timeline
10 weeks
Team
4 User Researchers
Organization
DePaul University (graduate project)

Overview
Overview
The COVID-19 pandemic created a significant surge in demand for mental health support. A 2020 American Psychological Association survey of 1,800 psychologists found that 74% saw more patients with anxiety disorders than before the pandemic. Despite a growing number of online mental health resources, users struggled with overwhelming information, opaque provider credentials, and difficulty finding culturally competent care.
The WellMind project set out to understand how individuals use online resources to research mental health conditions and select providers, and where that experience breaks down.
Research Question
💡 How do individuals leverage online resources to research and seek professional help for mental health disorders, and what challenges arise during this process?
Research Process
Research Process
Approach
To answer this question, I contributed to a three-phase mixed-methods study designed to move from exploratory behavioral observation through rich qualitative insight to statistical validation. Each phase informed the next.
Phase | Method | N | Key Tools |
|---|---|---|---|
| Task-based observation and think-aloud | 8 | Zoom, Reframer, Miro |
| Semi-structured interviews | 8 | Atlas.ti, Miro |
| Quantitative Survey | 30 | Qualtrics, R Studio |
This sequential explanatory design allowed the team to surface hypotheses from behavioral observation, deepen understanding through interviews, and then rigorously test those hypotheses quantitatively, a structure critical for high-stakes domains like healthcare.
Phase 1: Contextual Observation
Methodology
Eight participants (ages 23–34) were recruited through personal networks and university communities across Illinois, California, New York, and Minnesota. Participants completed a scenario task (imagine you are experiencing work-related stress and want to find mental health support) using any website or tool they chose. Sessions were conducted primarily over Zoom with screen recording and think-aloud protocols.
My Role
My Contributions (Phase 1) | Team Contributions (Phase 1) |
|---|---|
|
|
Analysis with Miro
Session recordings were coded using the AEIOU framework (Activities, Environments, Interactions, Objects, Users). The team consolidated notes in Optimal Workshop’s Reframer, then migrated data into Miro for collaborative affinity diagramming.
💡 Miro served as our shared synthesis workspace across all three research phases. For the observations, each researcher logged their AEIOU-coded notes independently, then the whole team met virtually to cluster 200+ data points by theme. The visual, drag-and-drop environment let us rapidly iterate on groupings, surface disagreements, and reach consensus on emergent patterns in real time, a workflow far more effective than a shared spreadsheet for interpretive work at this scale.
Key Behavioral Insights
👤 Users began with broad condition-based searches before narrowing to specific providers
🔍 Heavy reliance on filter tools: location, insurance, and specialty were prioritized
📰 Cross-platform validation: participants triangulated information across Psychology Today, WebMD, Reddit, and social media
😞 Visible frustration when profiles were incomplete, generic, or difficult to interpret
Phase 2: In-Depth Interviews
Methodology
Eight participants who had actively used online mental health resources within the previous 12 months were recruited through personal networks and online message boards. This cohort spanned Hawaii, Washington D.C., Maryland, California, and Illinois, and was more diverse in gender identity (6 female, 1 male, 1 nonbinary). Sessions averaged 45–60 minutes.
My Role
My Contributions (Phase 2) | Team Contributions (Phase 2) |
|---|---|
|
|
Qualitative Coding with Atlas.ti
All interview transcripts were imported into Atlas.ti for systematic qualitative analysis. I took the lead on coding, working through transcripts independently before bringing preliminary codes to the team for review and reconciliation into a shared codebook.
This process involved:
Open coding to surface initial concepts directly from transcript language
Code grouping to cluster related concepts (e.g., all codes related to provider trust consolidated together)
Theme development to identify the four major patterns that emerged across participants
Quotation retrieval to pull representative verbatim examples for each theme, preserving the evidentiary chain
💡 Atlas.ti provided the rigor and auditability that manual annotation cannot. By maintaining a codebook with definitions, codes could be applied consistently across transcripts and any theme traced back to its supporting quotations. This is essential when presenting findings to stakeholders or teams who weren’t in the room.
Key Themes from Interviews
Mental Health Literacy Gap
Seven of eight participants reported lacking confidence in their mental health literacy: not knowing what conditions they might have, how to interpret clinical terminology, or how to evaluate provider credentials. This created anxiety layered on top of anxiety during the research process.
Provider Fit Above All Else
Cultural competency was the most emotionally charged theme. Participants described searching specifically for BIPOC or LGBTQIA+-allied therapists, often with great difficulty.
Information Quality Over Quantity
Participants consistently preferred depth of information over breadth. Generic profiles raised skepticism rather than trust. They wanted treatment approaches explained in plain language, not a list of bullet-pointed specialties.
Scheduling Friction as Abandonment Trigger
Multiple participants described a demoralizing loop: identify a promising provider, call the office, discover they are not accepting new patients, repeat. Administrative friction around scheduling was a significant emotional drop-off point.
Personas
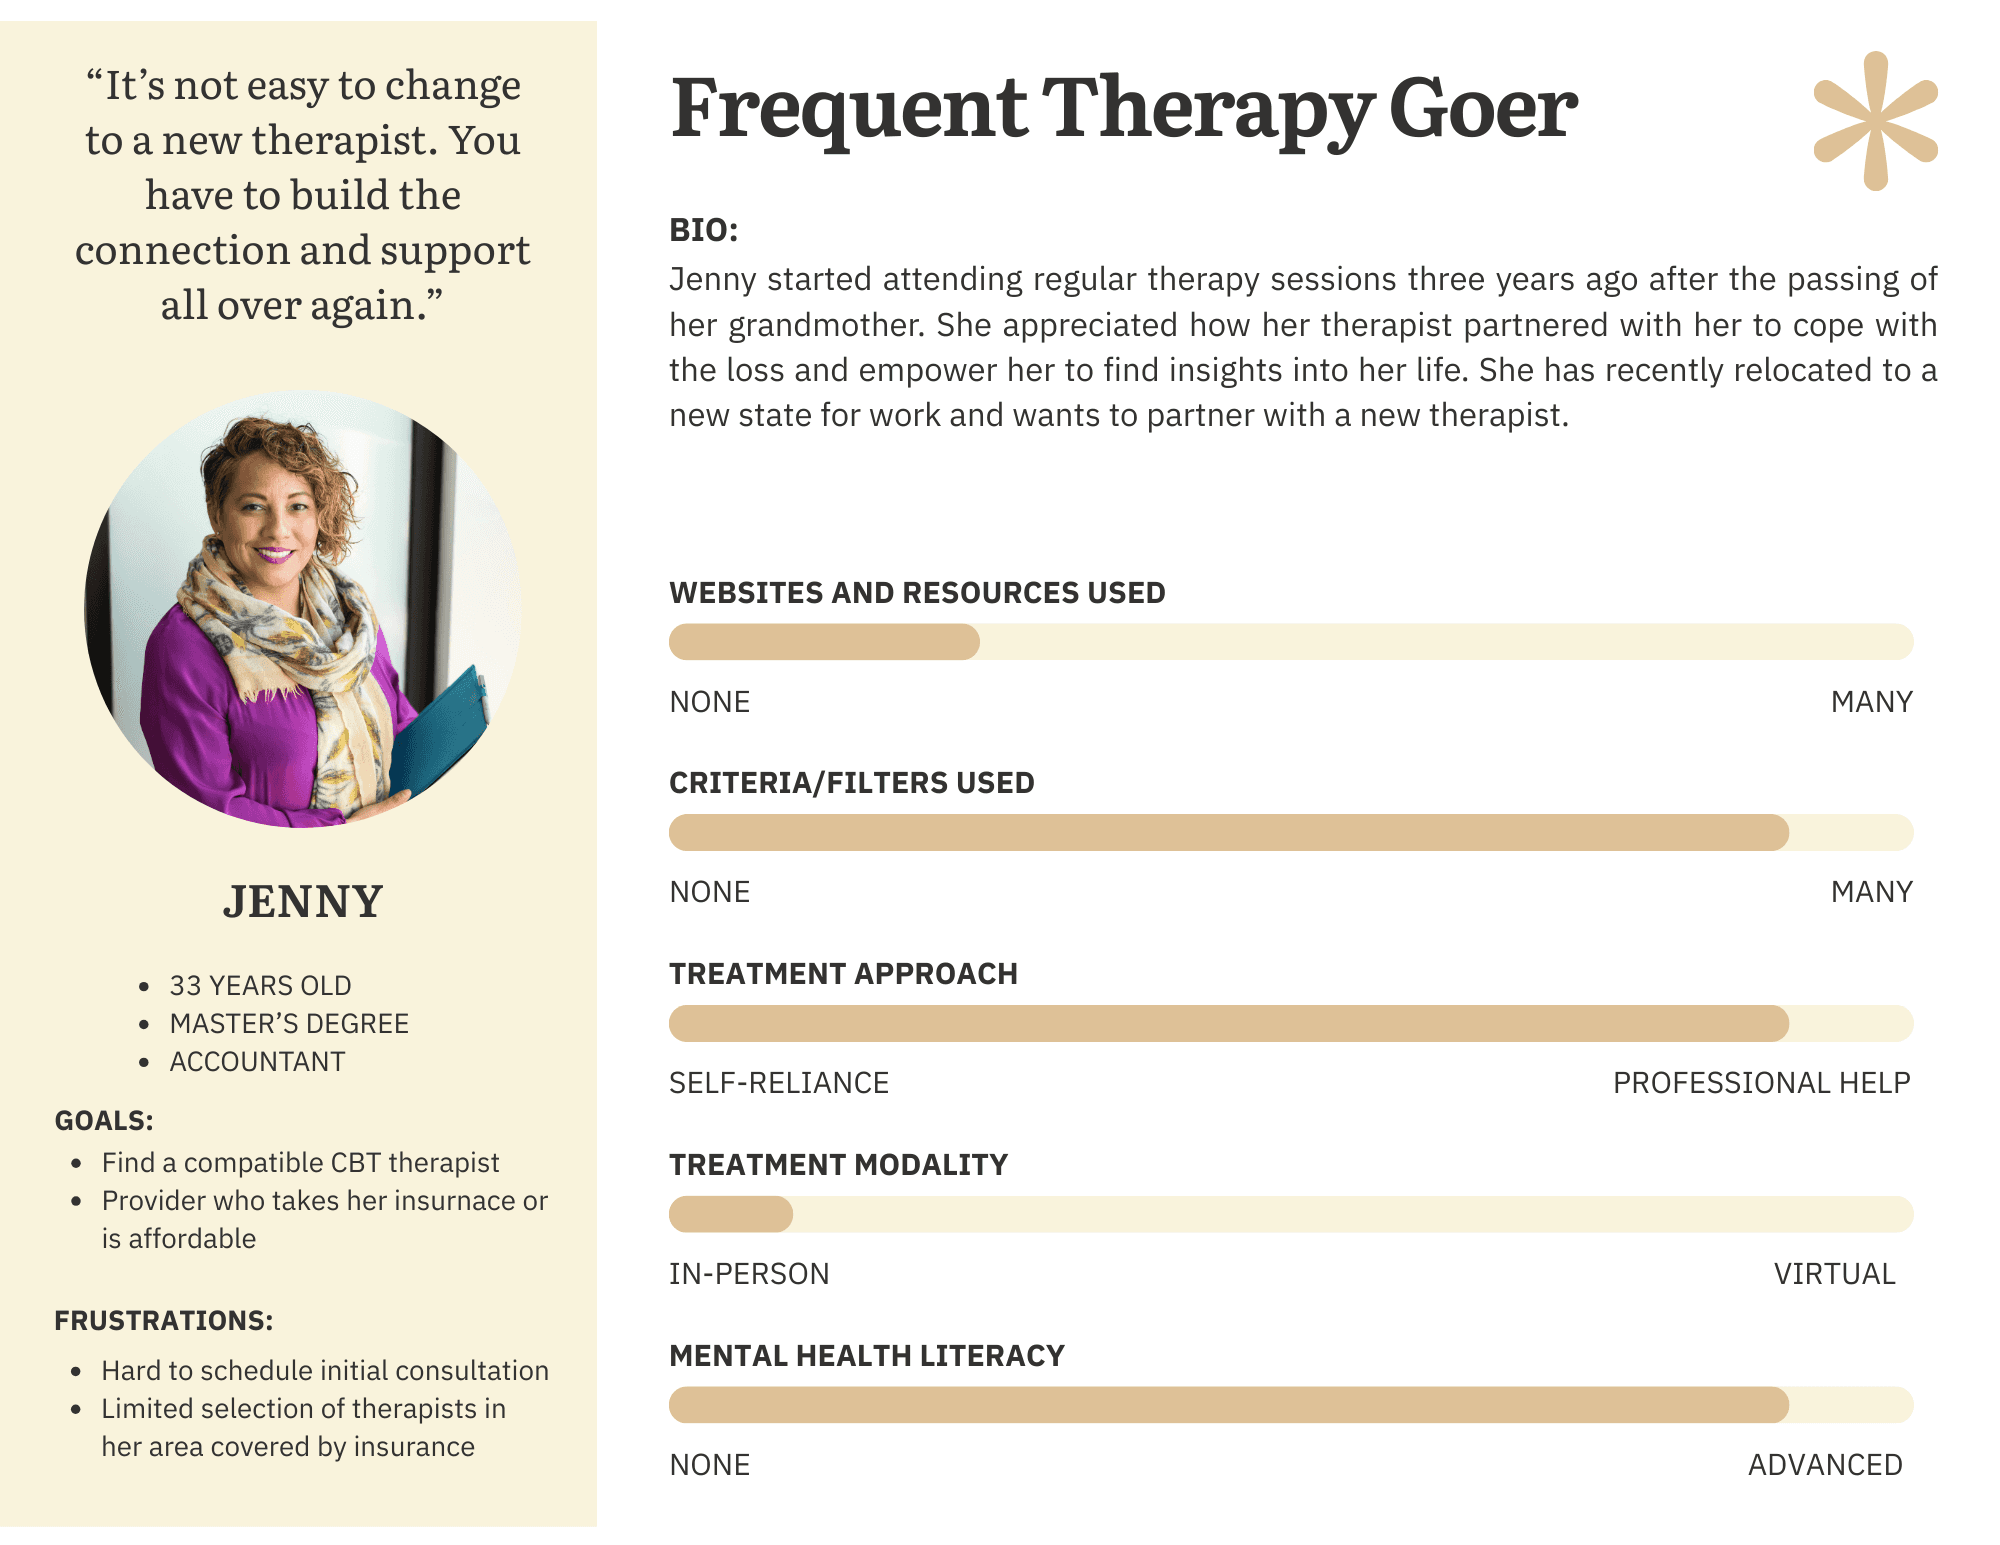
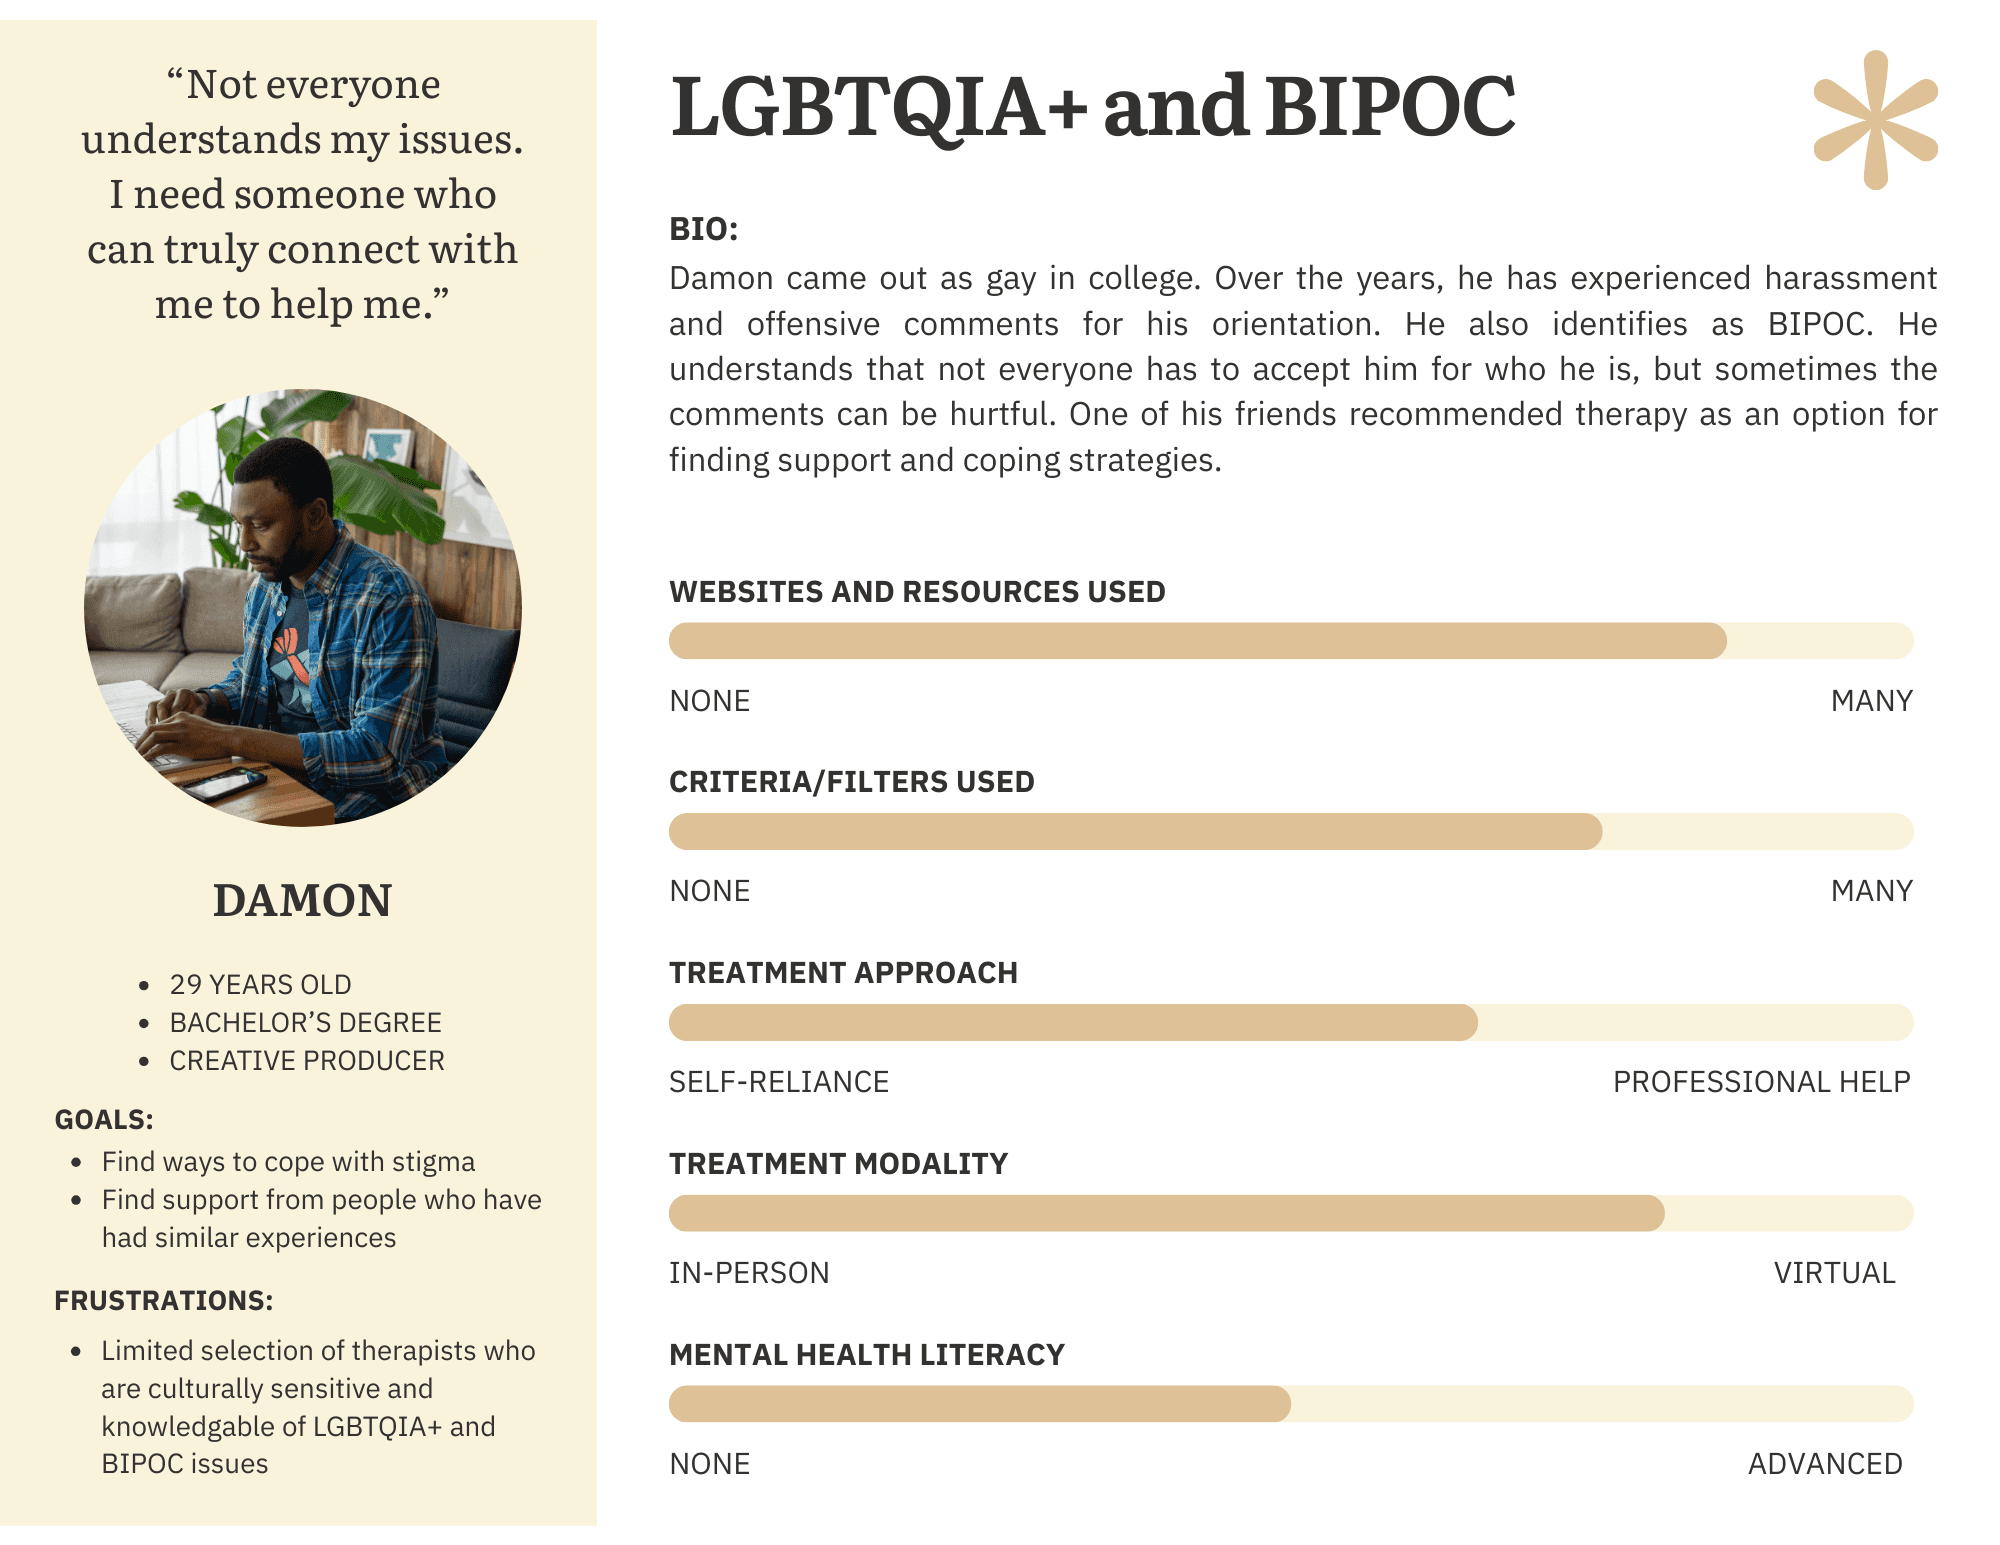
Based on interview and observation synthesis, the team developed three behavioral personas representing distinct user archetypes. The personas were created by a teammate; my contribution was the behavioral and attitudinal data from interviews that informed them.
Phase 3: Survey Research
Purpose and Design
The survey was designed to validate (and where necessary challenge) patterns identified in observations and interviews. Qualitative data is rich but limited in generalizability; the survey added a quantitative layer to assess the prevalence of patterns across a broader sample.
The instrument was deployed via Qualtrics to 30 participants meeting the same screening criteria as the interview cohort (18+, used online mental health resources in the past 12 months). Geographic representation spanned IL, CA, NY, MN, HI, DC, and MD.
My Role
My Contributions (Phase 3) | Team Contributions (Phase 3) |
|---|---|
|
|
Hypothesis Testing
Primary hypothesis: Users with higher mental health literacy (operationalized as research frequency) would experience less difficulty selecting a provider.
Given the ordinal nature of both variables, I used Spearman’s rank correlation in R Studio, the appropriate non-parametric test for this data type.
💡 The correlation between research frequency and selection difficulty was not statistically significant (rho = −0.085, p = 0.66). This null result was itself meaningful: the problem is not simply how much users research, but the quality and structure of available information. The barrier is systemic, not individual — and that reframing had direct implications for design.
Therapist Preferences
Participants rated the importance of therapist attributes on a 1–10 scale. Specialization in specific conditions emerged as the top priorities.
Convenience and Access Factors
Insurance acceptance was the single highest-rated criterion overall (median 10/10, mean 8.83). Wait time and virtual session availability followed closely.
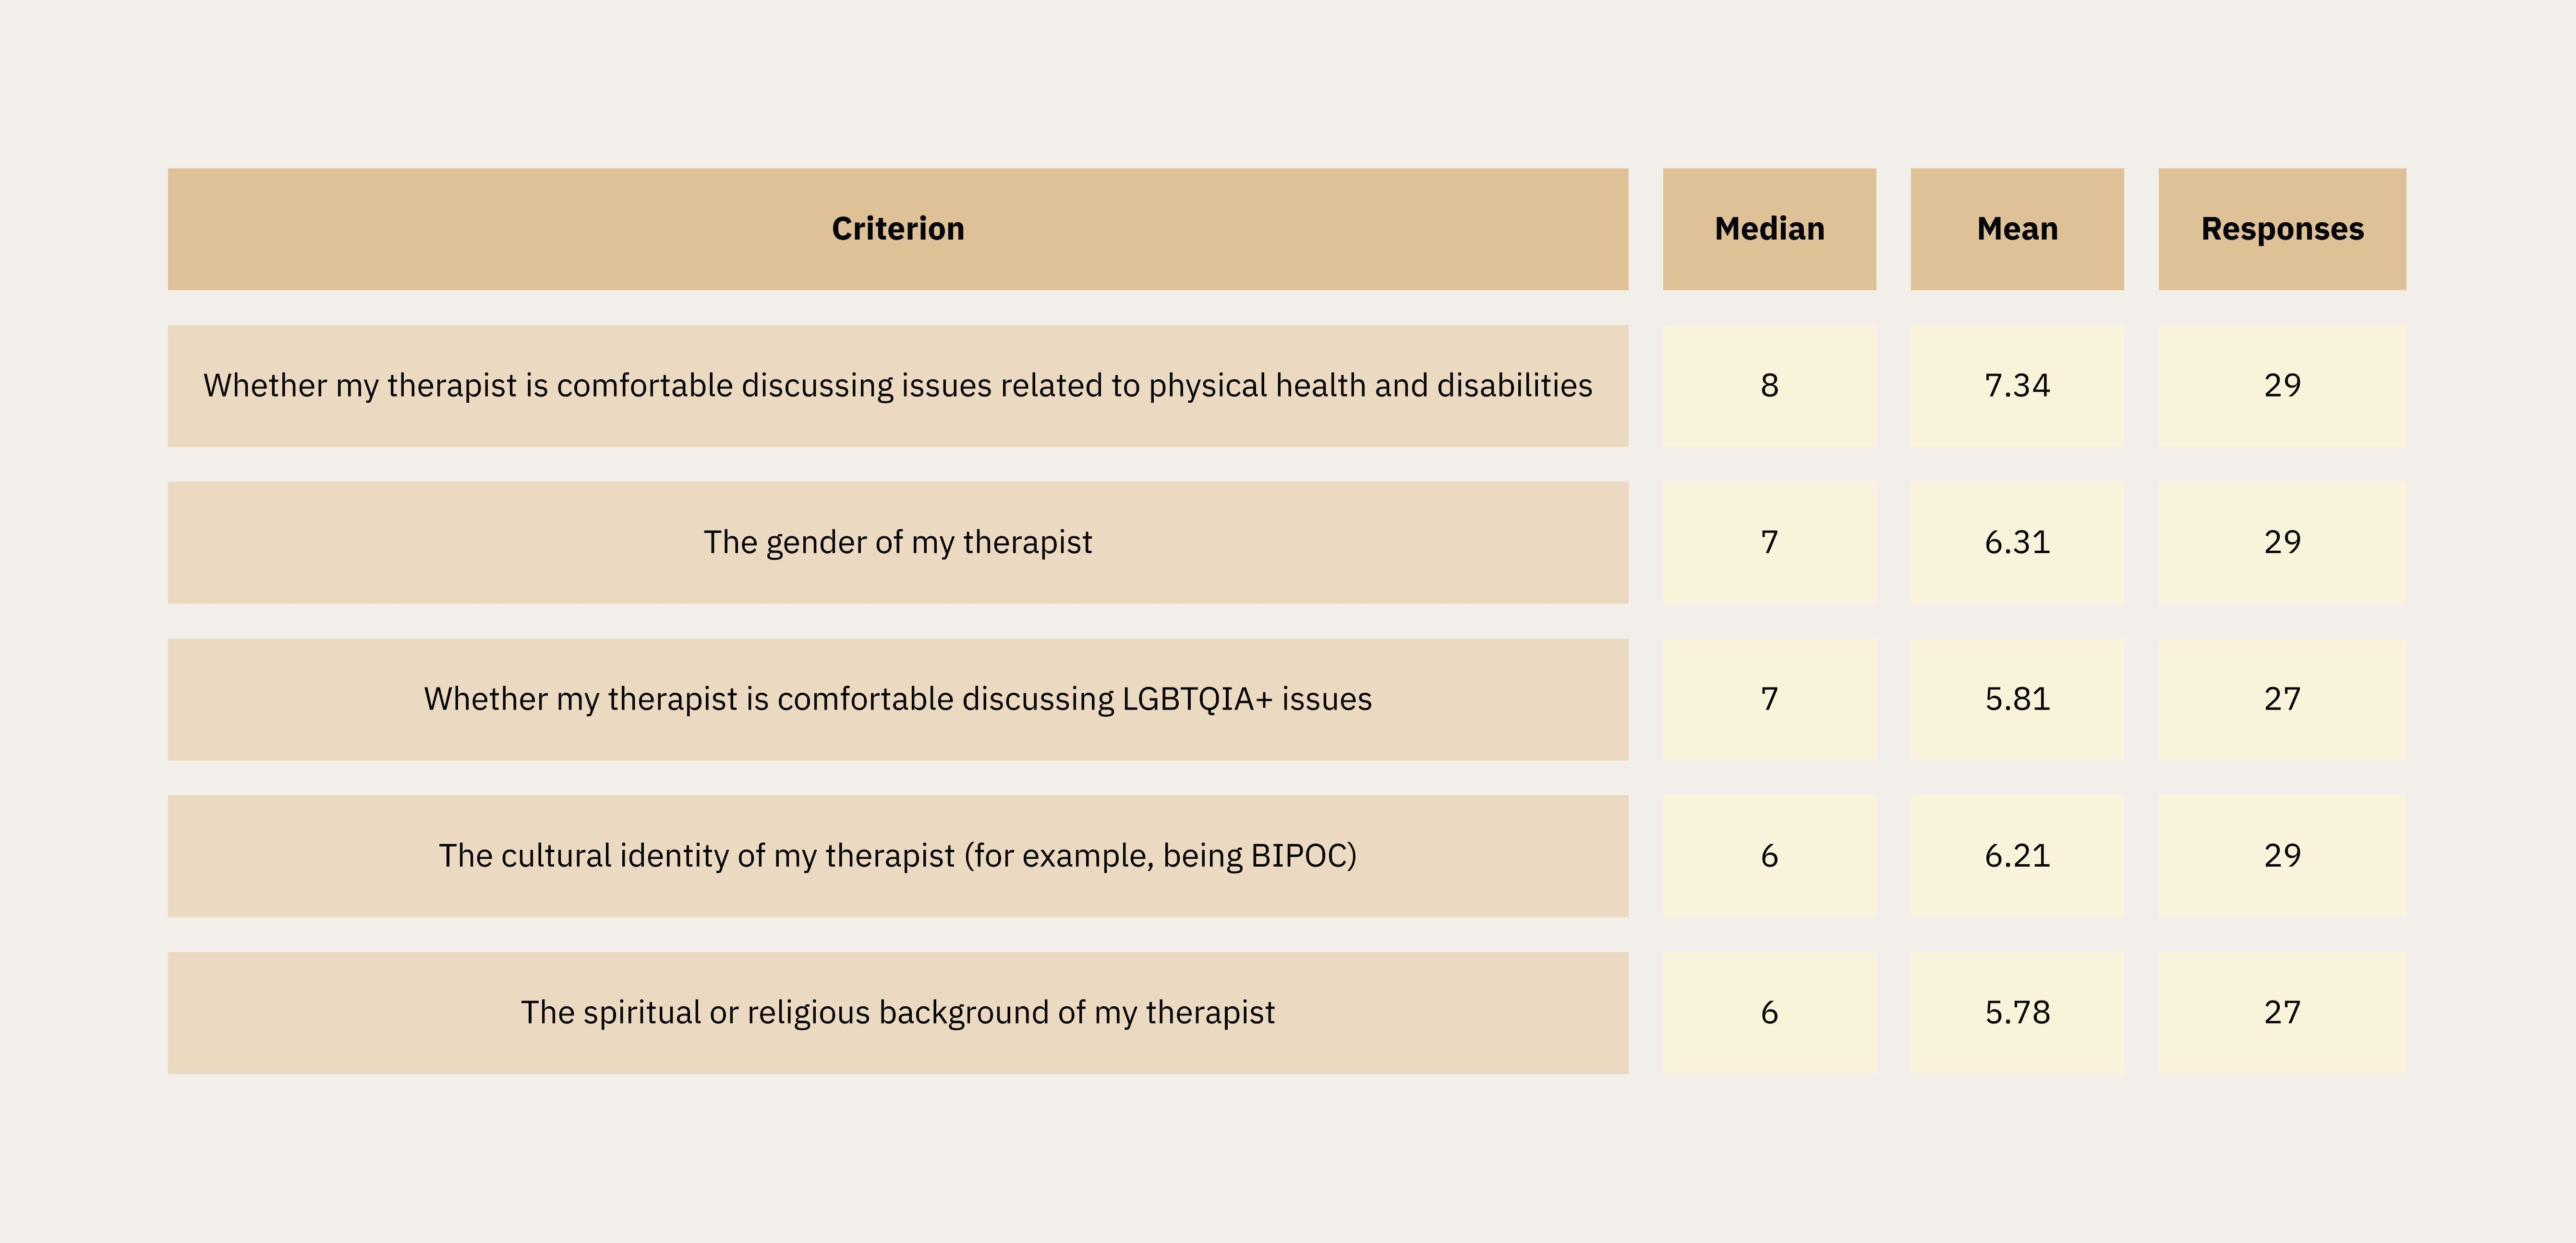
Cultural Compatibility Factors
Comfort discussing physical health and disabilities ranked highest among cultural criteria. Comfort discussing LGBTQIA+ issues and cultural identity (BIPOC) were both rated with a median of 6–7, validating the qualitative findings on the importance of cultural fit.
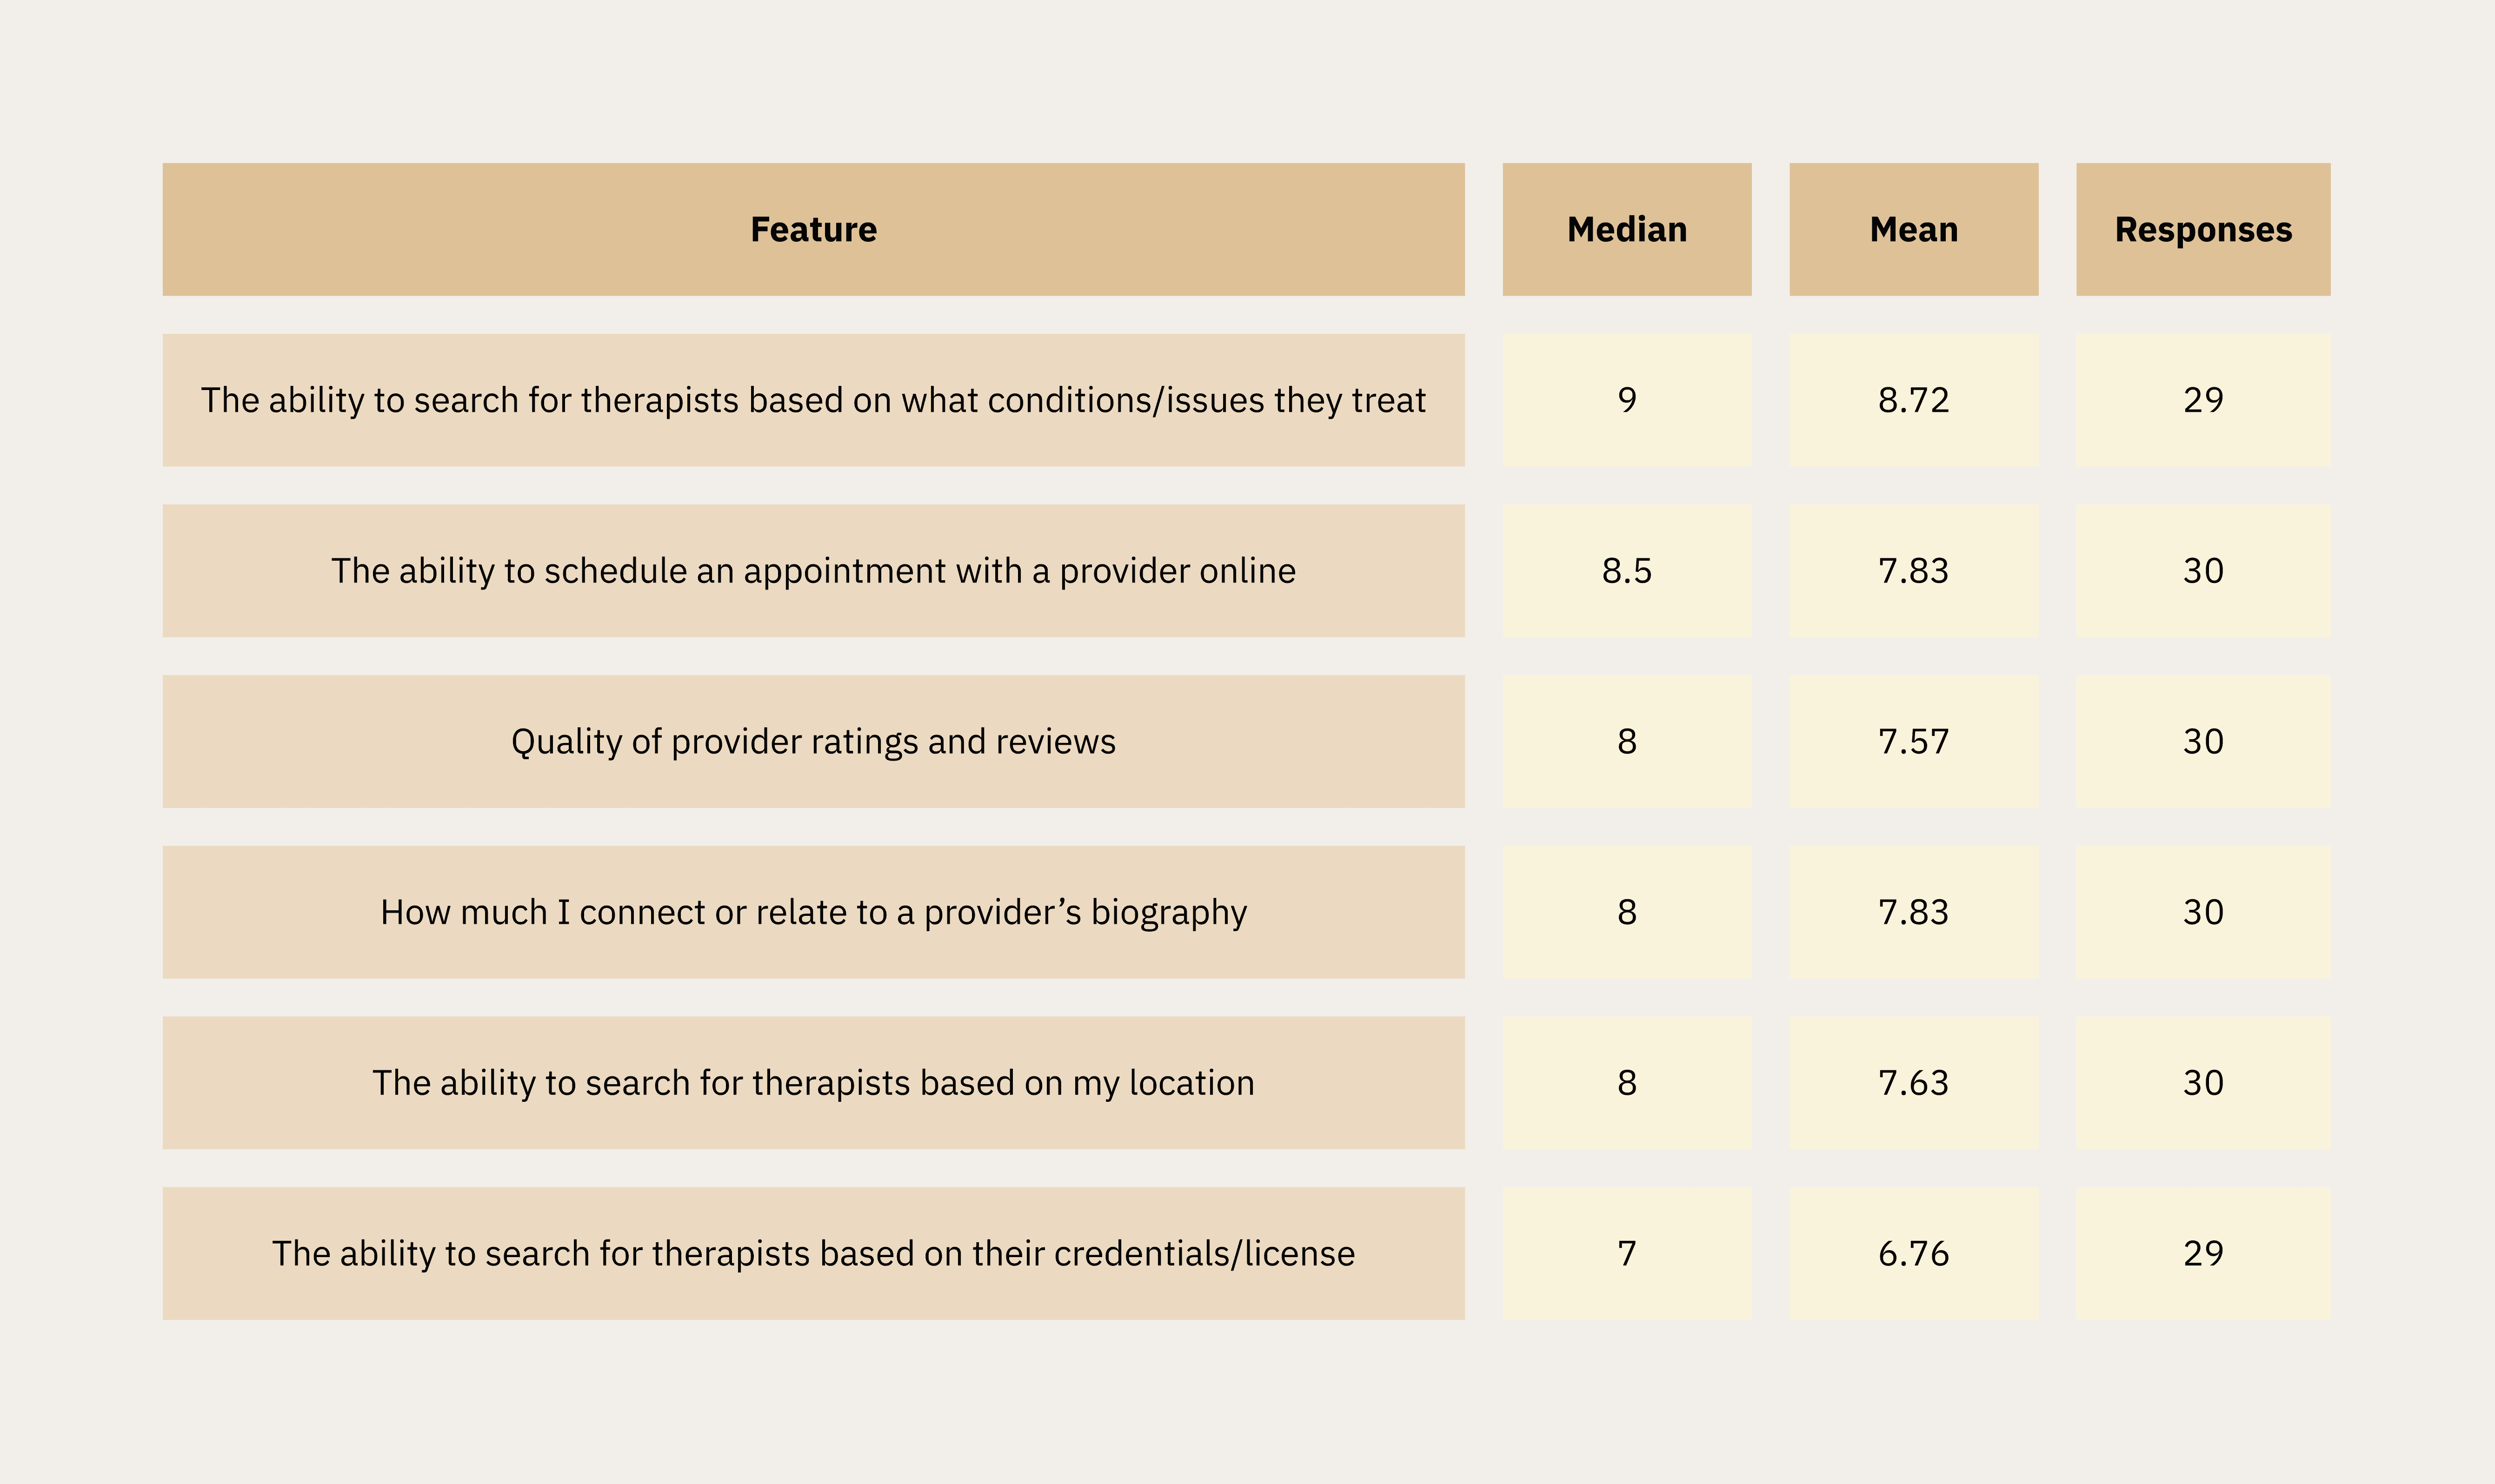
Search and Filtering Features
The ability to search by condition/issue was the highest-rated feature (median 9/10). Scheduling online was also important to users, with a median 8.5, and ratings and reviews and connecting with a provider’s biography tied at median 8, confirming qualitative themes around scheduling friction and profile depth.
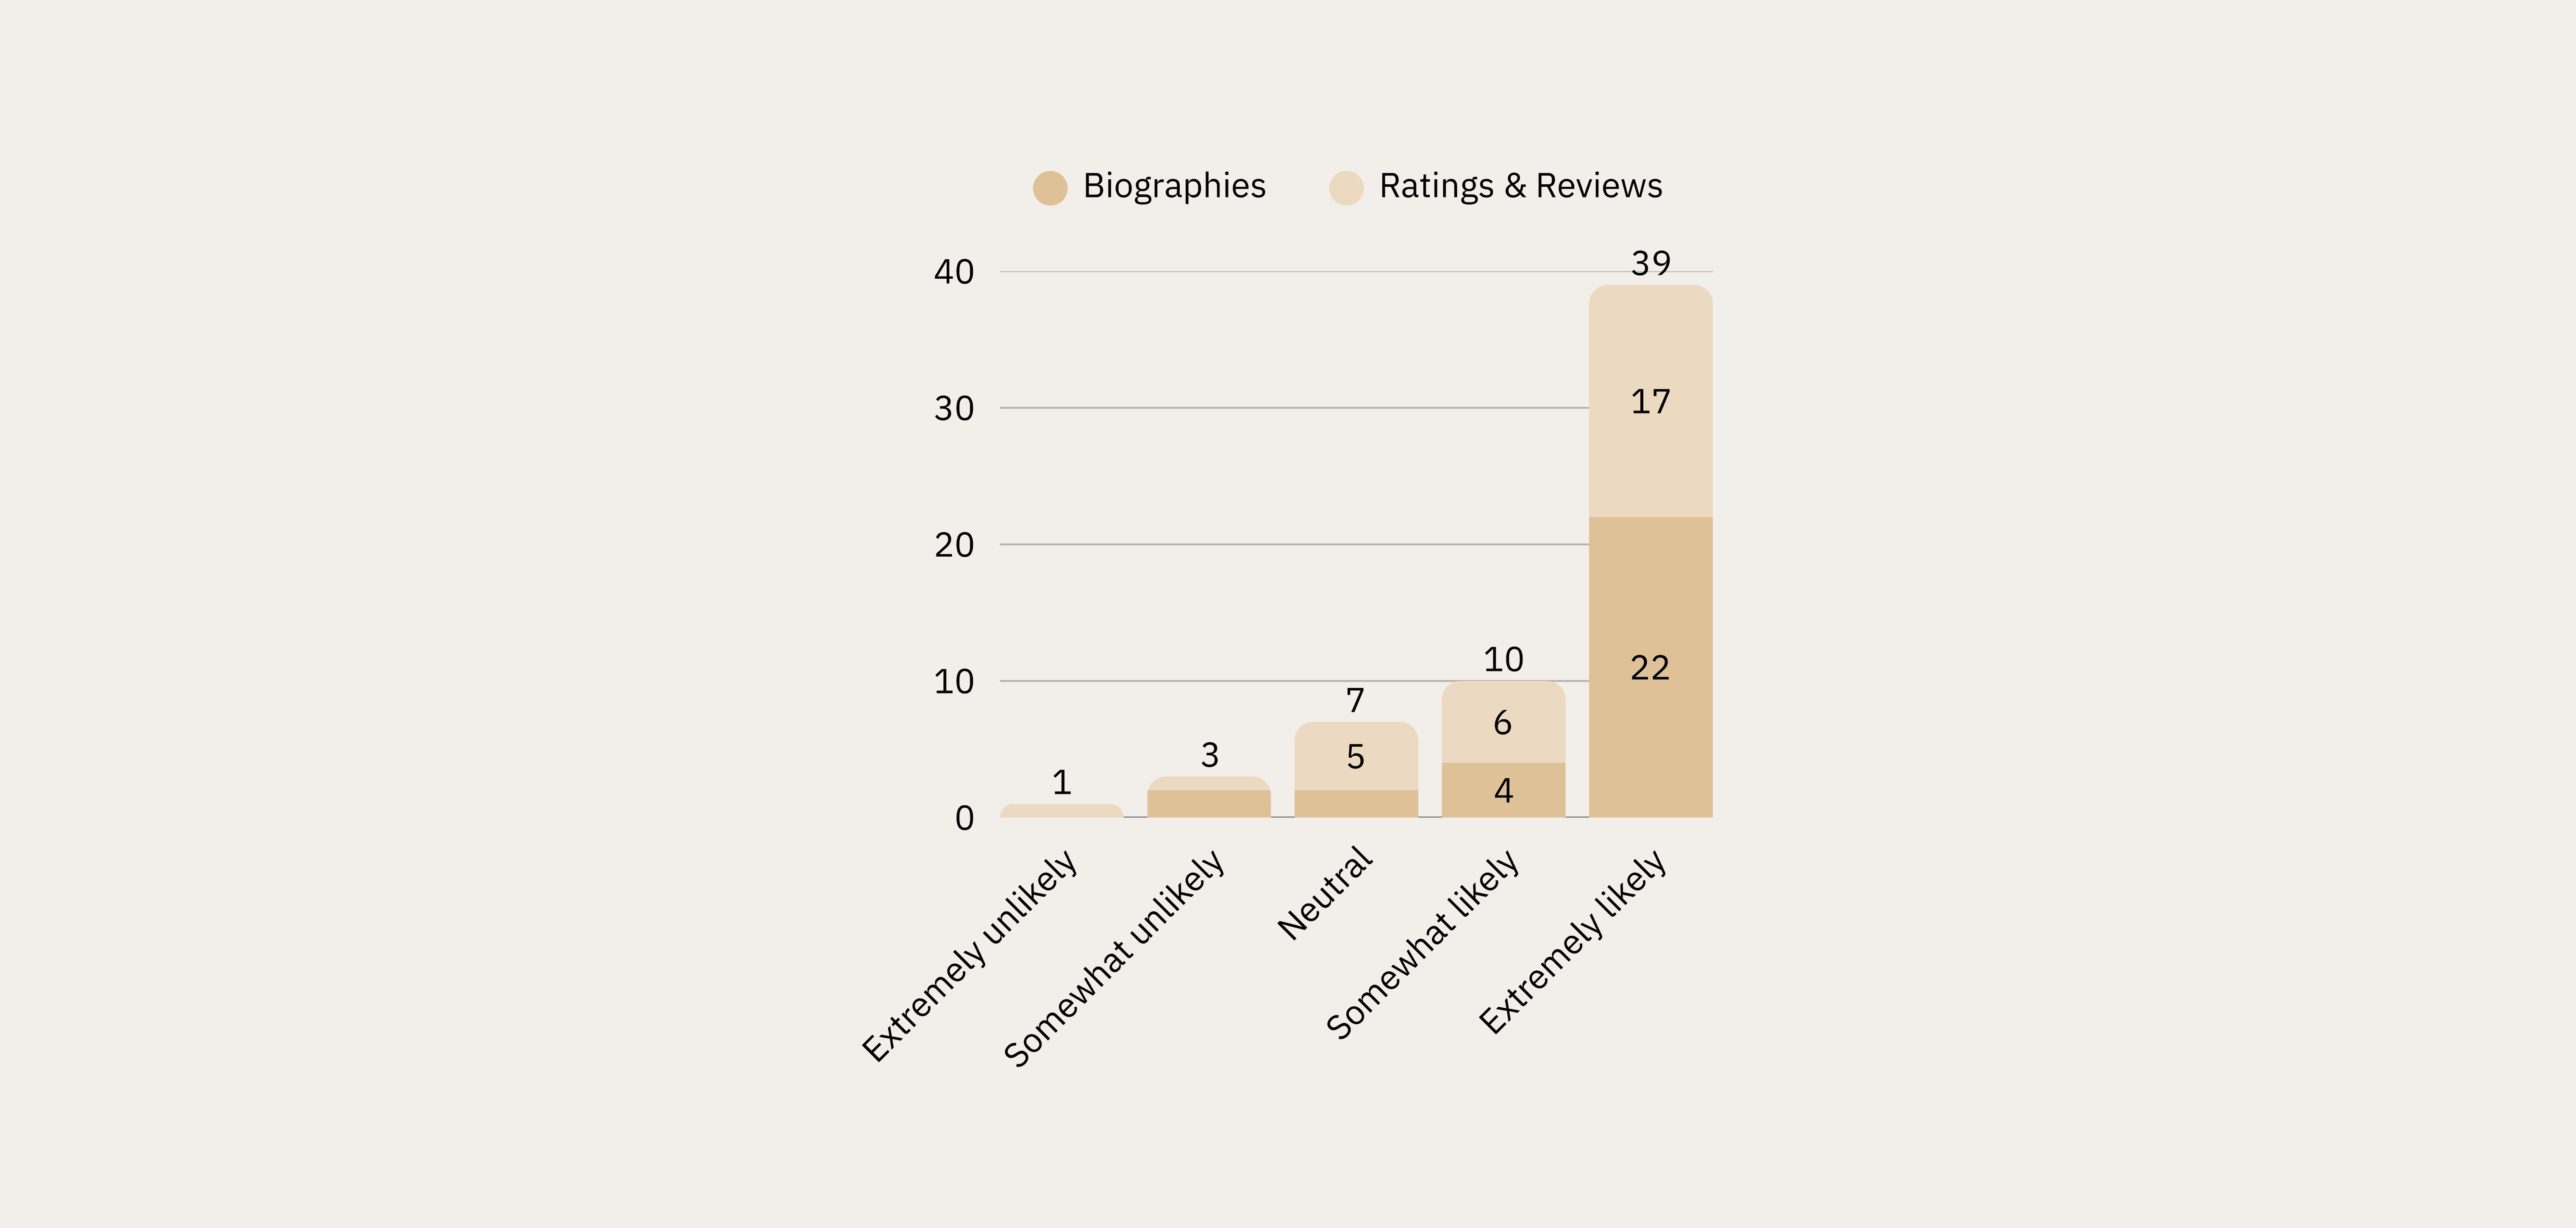
Biographies vs. Ratings & Reviews
Respondents showed a preference for biographies over ratings/reviews of therapists.
73% reported that they would be extremely likely to use biographies to help them decide, compared to 56.7% who reported that they would be extremely likely to use ratings and reviews (n=30).
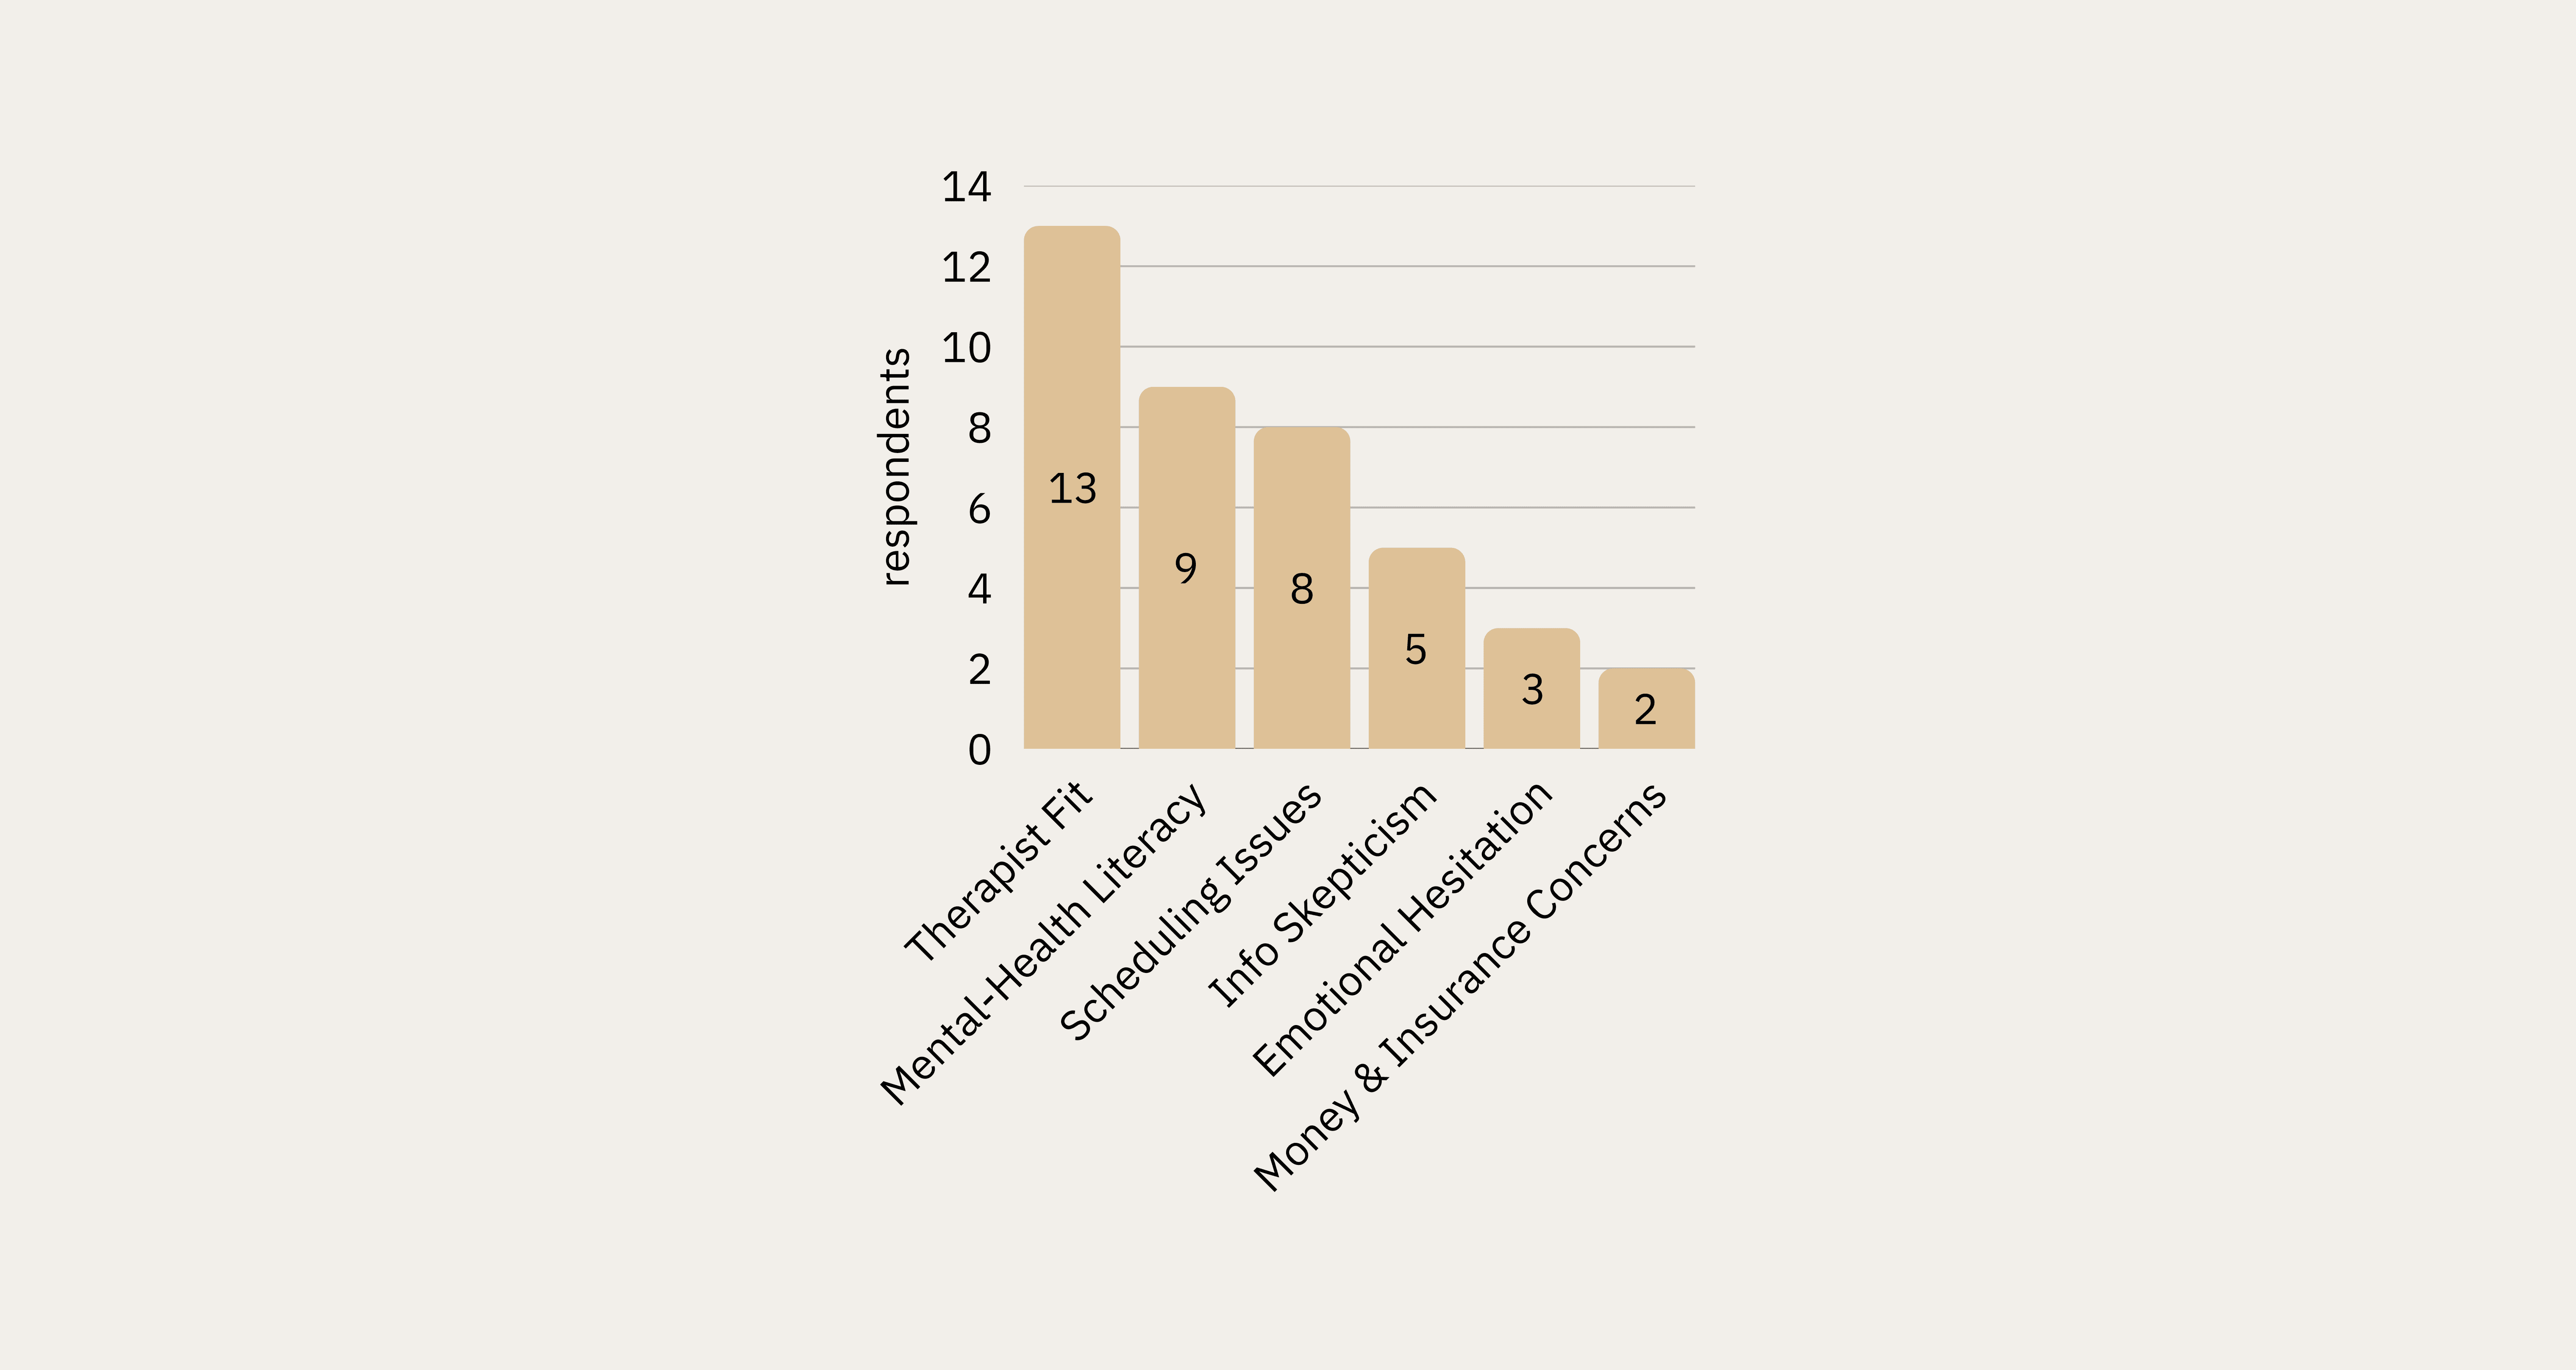
What Makes Selecting a Therapist Online Difficult?
Therapist fit was the most commonly cited barrier to selection (13 respondents), followed by mental health literacy (9) and scheduling issues (8). This triangulated directly with the top themes from interviews.
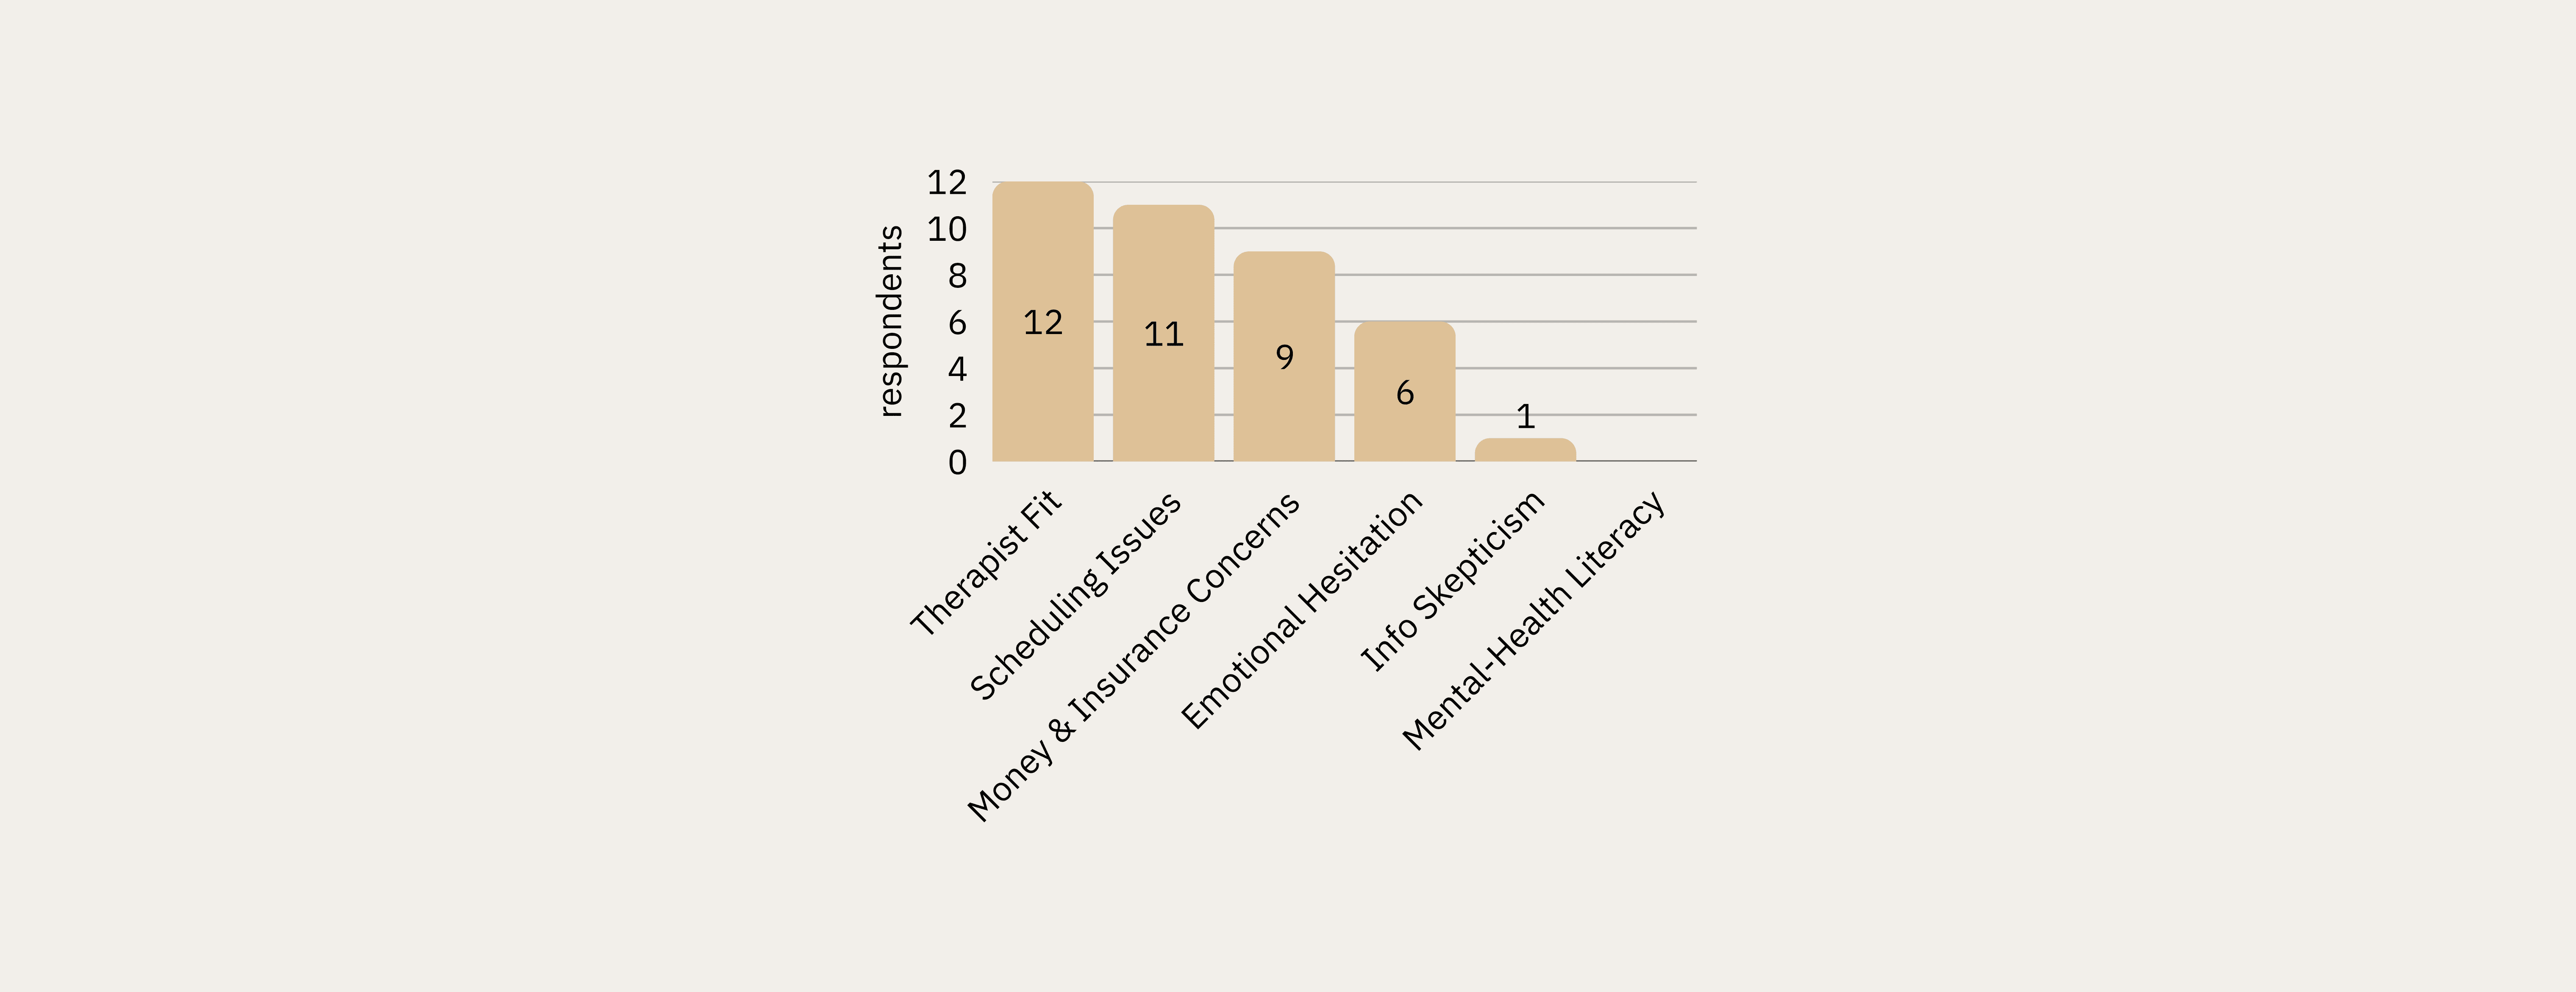
What Would Stop You From Scheduling?
Therapist fit and scheduling issues topped the list of abandonment triggers, with money and insurance concerns close behind (9 respondents). Notably, mental health literacy — the #2 barrier to selection — ranked last as a scheduling barrier, suggesting literacy concerns dissipate once a user has narrowed their choice.
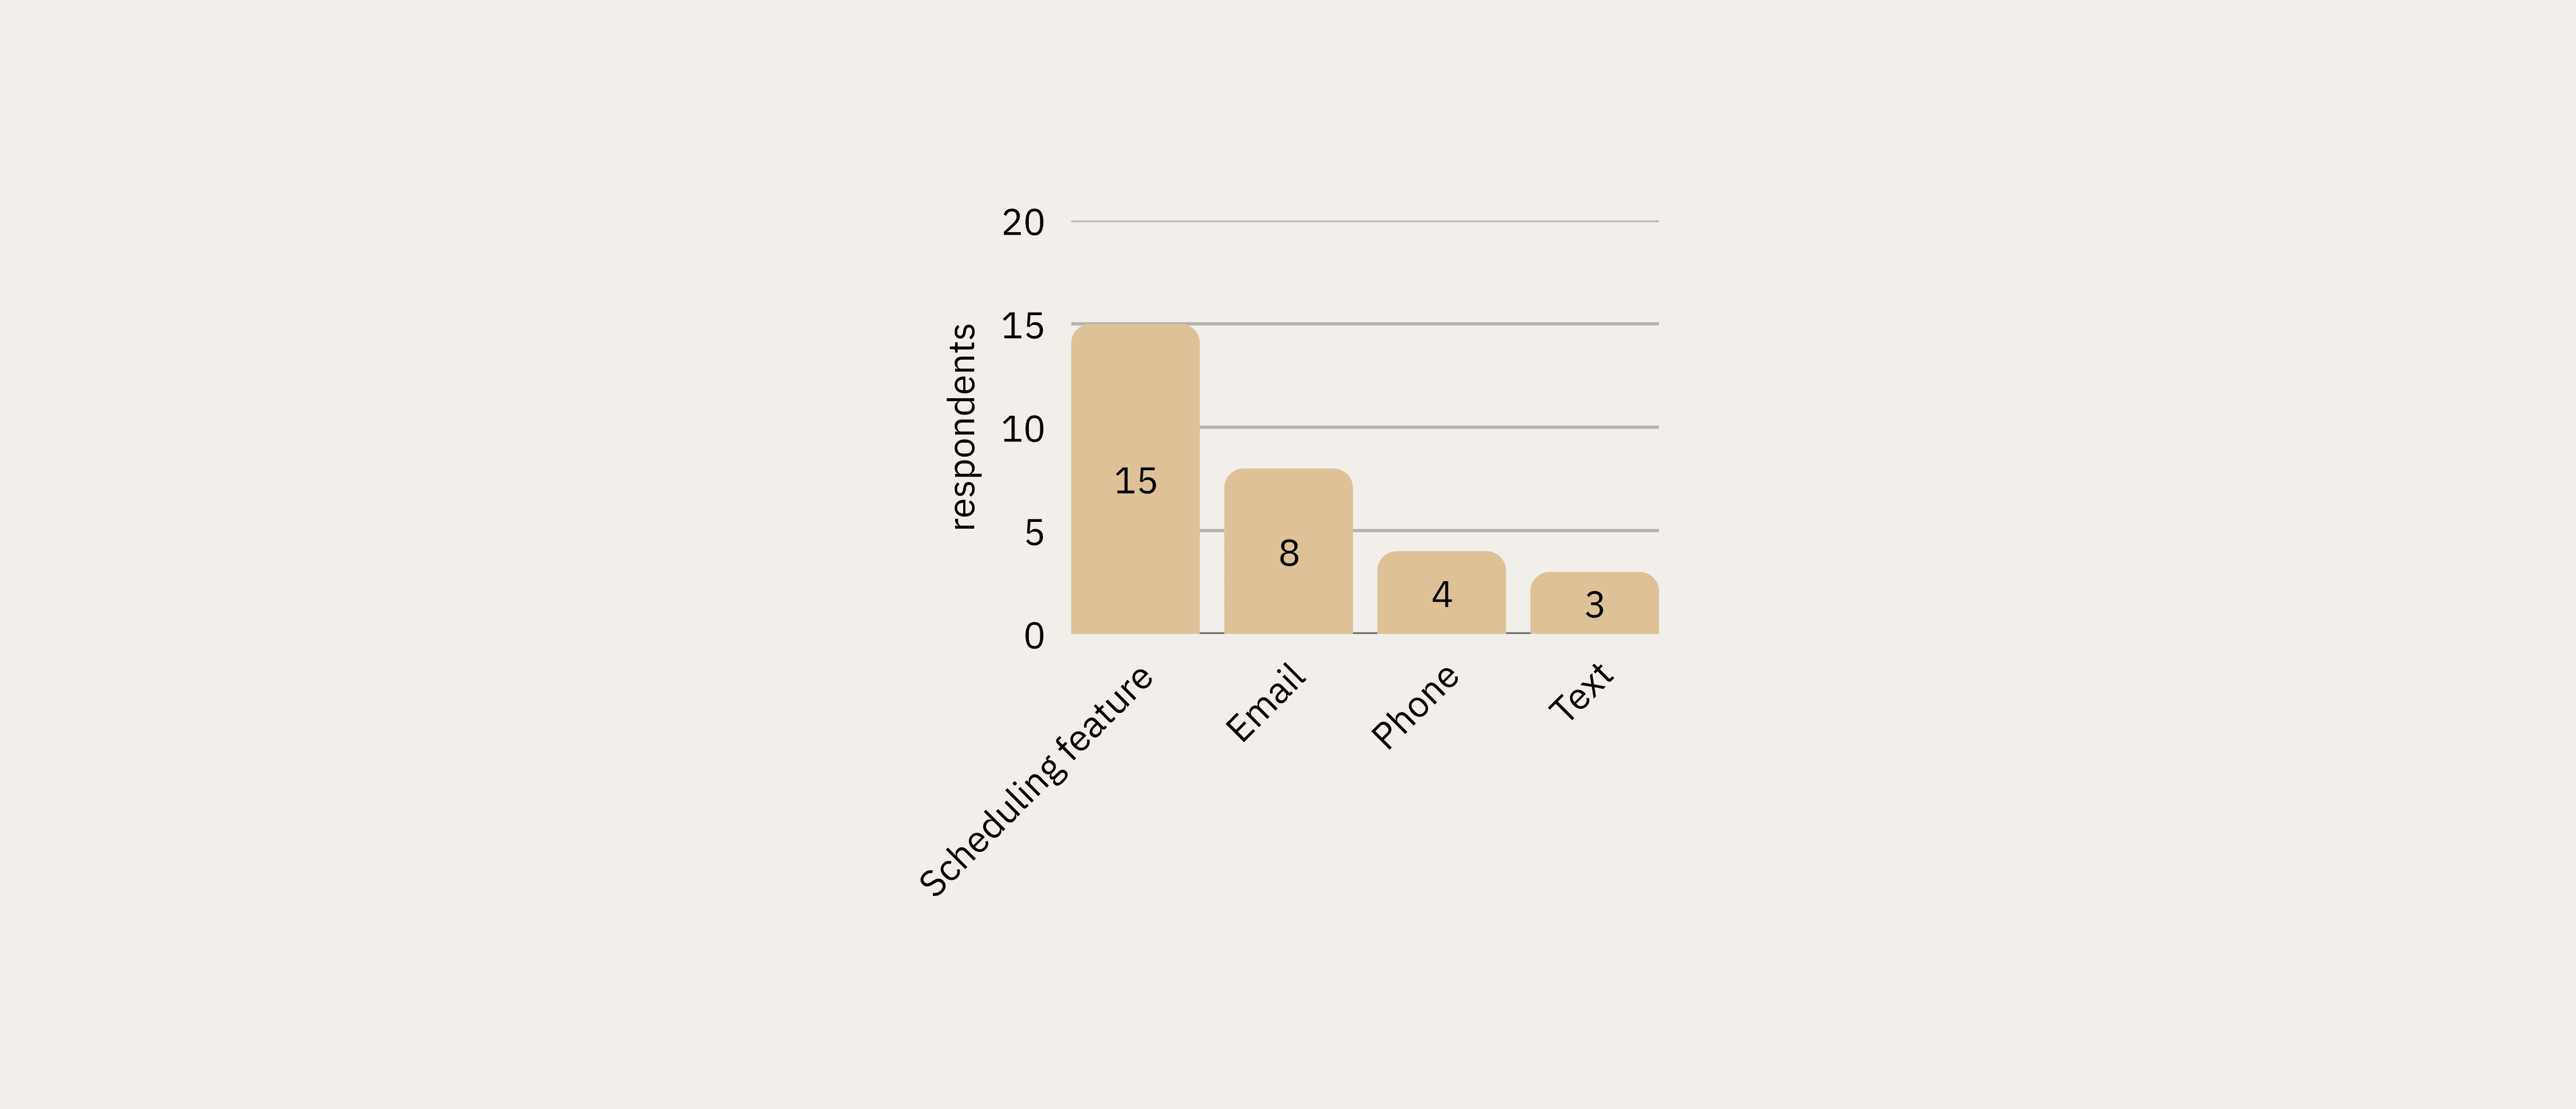
Preferred Scheduling Method
Online scheduling via website or app was preferred by 50% of respondents (15 of 30), outpacing email (8), phone (4), and text (3). This directly validated the qualitative finding that phone-based scheduling friction was a key pain point.
Design Implications & Feature Recommendations
Research findings were synthesized into a feature prioritization matrix for the WellMind platform, with each feature grounded in specific evidence from across all three research phases.
Feature | Priority | Research Basis |
|---|---|---|
Compatibility questionnaire | High | All three phases showed provider compatibility & cultural fit as paramount |
Enhanced provider profiles | High | 73% found biographies most helpful; qualitative data confirmed demand for transparency |
Real-time scheduling | High | 50% preferred online scheduling; scheduling friction was a top abandonment trigger |
Specialty verification | High | Specialization was highest-rated therapist preference criterion (median 9/10) |
Community forum | Medium | 90% used online resources vs. 50% professional advice — peer support in demand |
Credential glossary | Medium | Mental health literacy gap identified across interviews and confirmed in survey |
Approach
To answer this question, I contributed to a three-phase mixed-methods study designed to move from exploratory behavioral observation through rich qualitative insight to statistical validation. Each phase informed the next.
Phase | Method | N | Key Tools |
|---|---|---|---|
| Task-based observation and think-aloud | 8 | Zoom, Reframer, Miro |
| Semi-structured interviews | 8 | Atlas.ti, Miro |
| Quantitative Survey | 30 | Qualtrics, R Studio |
This sequential explanatory design allowed the team to surface hypotheses from behavioral observation, deepen understanding through interviews, and then rigorously test those hypotheses quantitatively, a structure critical for high-stakes domains like healthcare.
Phase 1: Contextual Observation
Methodology
Eight participants (ages 23–34) were recruited through personal networks and university communities across Illinois, California, New York, and Minnesota. Participants completed a scenario task (imagine you are experiencing work-related stress and want to find mental health support) using any website or tool they chose. Sessions were conducted primarily over Zoom with screen recording and think-aloud protocols.
My Role
My Contributions (Phase 1) | Team Contributions (Phase 1) |
|---|---|
|
|
Analysis with Miro
Session recordings were coded using the AEIOU framework (Activities, Environments, Interactions, Objects, Users). The team consolidated notes in Optimal Workshop’s Reframer, then migrated data into Miro for collaborative affinity diagramming.
💡 Miro served as our shared synthesis workspace across all three research phases. For the observations, each researcher logged their AEIOU-coded notes independently, then the whole team met virtually to cluster 200+ data points by theme. The visual, drag-and-drop environment let us rapidly iterate on groupings, surface disagreements, and reach consensus on emergent patterns in real time, a workflow far more effective than a shared spreadsheet for interpretive work at this scale.
Key Behavioral Insights
👤 Users began with broad condition-based searches before narrowing to specific providers
🔍 Heavy reliance on filter tools: location, insurance, and specialty were prioritized
📰 Cross-platform validation: participants triangulated information across Psychology Today, WebMD, Reddit, and social media
😞 Visible frustration when profiles were incomplete, generic, or difficult to interpret
Phase 2: In-Depth Interviews
Methodology
Eight participants who had actively used online mental health resources within the previous 12 months were recruited through personal networks and online message boards. This cohort spanned Hawaii, Washington D.C., Maryland, California, and Illinois, and was more diverse in gender identity (6 female, 1 male, 1 nonbinary). Sessions averaged 45–60 minutes.
My Role
My Contributions (Phase 2) | Team Contributions (Phase 2) |
|---|---|
|
|
Qualitative Coding with Atlas.ti
All interview transcripts were imported into Atlas.ti for systematic qualitative analysis. I took the lead on coding, working through transcripts independently before bringing preliminary codes to the team for review and reconciliation into a shared codebook.
This process involved:
Open coding to surface initial concepts directly from transcript language
Code grouping to cluster related concepts (e.g., all codes related to provider trust consolidated together)
Theme development to identify the four major patterns that emerged across participants
Quotation retrieval to pull representative verbatim examples for each theme, preserving the evidentiary chain
💡 Atlas.ti provided the rigor and auditability that manual annotation cannot. By maintaining a codebook with definitions, codes could be applied consistently across transcripts and any theme traced back to its supporting quotations. This is essential when presenting findings to stakeholders or teams who weren’t in the room.
Key Themes from Interviews
Mental Health Literacy Gap
Seven of eight participants reported lacking confidence in their mental health literacy: not knowing what conditions they might have, how to interpret clinical terminology, or how to evaluate provider credentials. This created anxiety layered on top of anxiety during the research process.
Provider Fit Above All Else
Cultural competency was the most emotionally charged theme. Participants described searching specifically for BIPOC or LGBTQIA+-allied therapists, often with great difficulty.
Information Quality Over Quantity
Participants consistently preferred depth of information over breadth. Generic profiles raised skepticism rather than trust. They wanted treatment approaches explained in plain language, not a list of bullet-pointed specialties.
Scheduling Friction as Abandonment Trigger
Multiple participants described a demoralizing loop: identify a promising provider, call the office, discover they are not accepting new patients, repeat. Administrative friction around scheduling was a significant emotional drop-off point.
Personas
Based on interview and observation synthesis, the team developed three behavioral personas representing distinct user archetypes. The personas were created by a teammate; my contribution was the behavioral and attitudinal data from interviews that informed them.
Phase 3: Survey Research
Purpose and Design
The survey was designed to validate (and where necessary challenge) patterns identified in observations and interviews. Qualitative data is rich but limited in generalizability; the survey added a quantitative layer to assess the prevalence of patterns across a broader sample.
The instrument was deployed via Qualtrics to 30 participants meeting the same screening criteria as the interview cohort (18+, used online mental health resources in the past 12 months). Geographic representation spanned IL, CA, NY, MN, HI, DC, and MD.
My Role
My Contributions (Phase 3) | Team Contributions (Phase 3) |
|---|---|
|
|
Hypothesis Testing
Primary hypothesis: Users with higher mental health literacy (operationalized as research frequency) would experience less difficulty selecting a provider.
Given the ordinal nature of both variables, I used Spearman’s rank correlation in R Studio, the appropriate non-parametric test for this data type.
💡 The correlation between research frequency and selection difficulty was not statistically significant (rho = −0.085, p = 0.66). This null result was itself meaningful: the problem is not simply how much users research, but the quality and structure of available information. The barrier is systemic, not individual — and that reframing had direct implications for design.
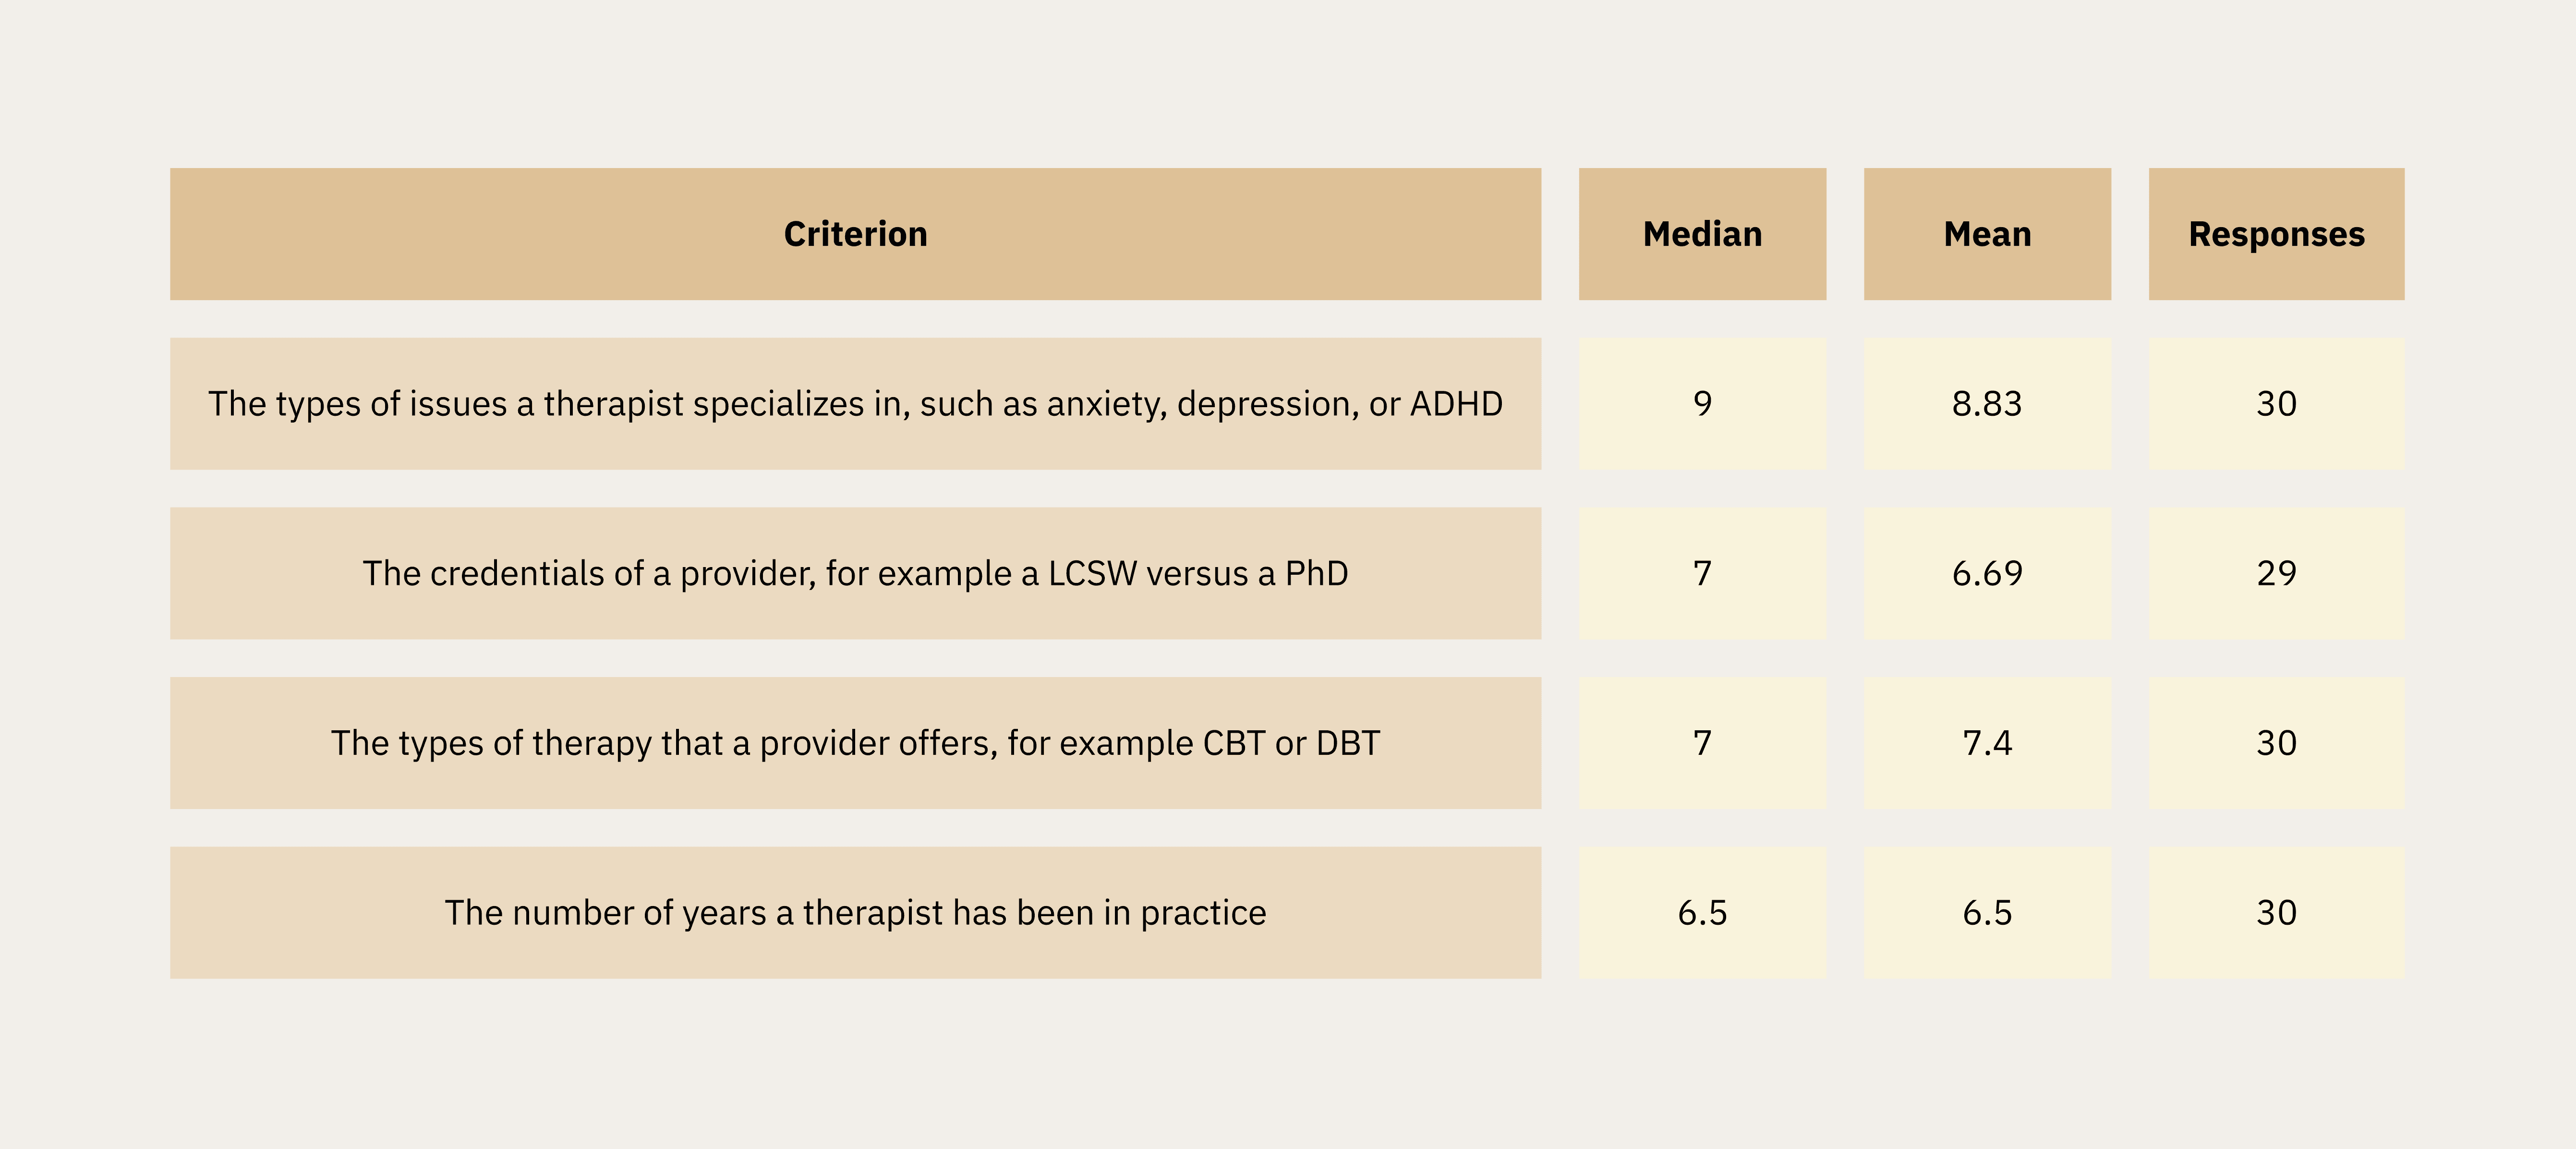
Therapist Preferences
Participants rated the importance of therapist attributes on a 1–10 scale. Specialization in specific conditions emerged as the top priorities.
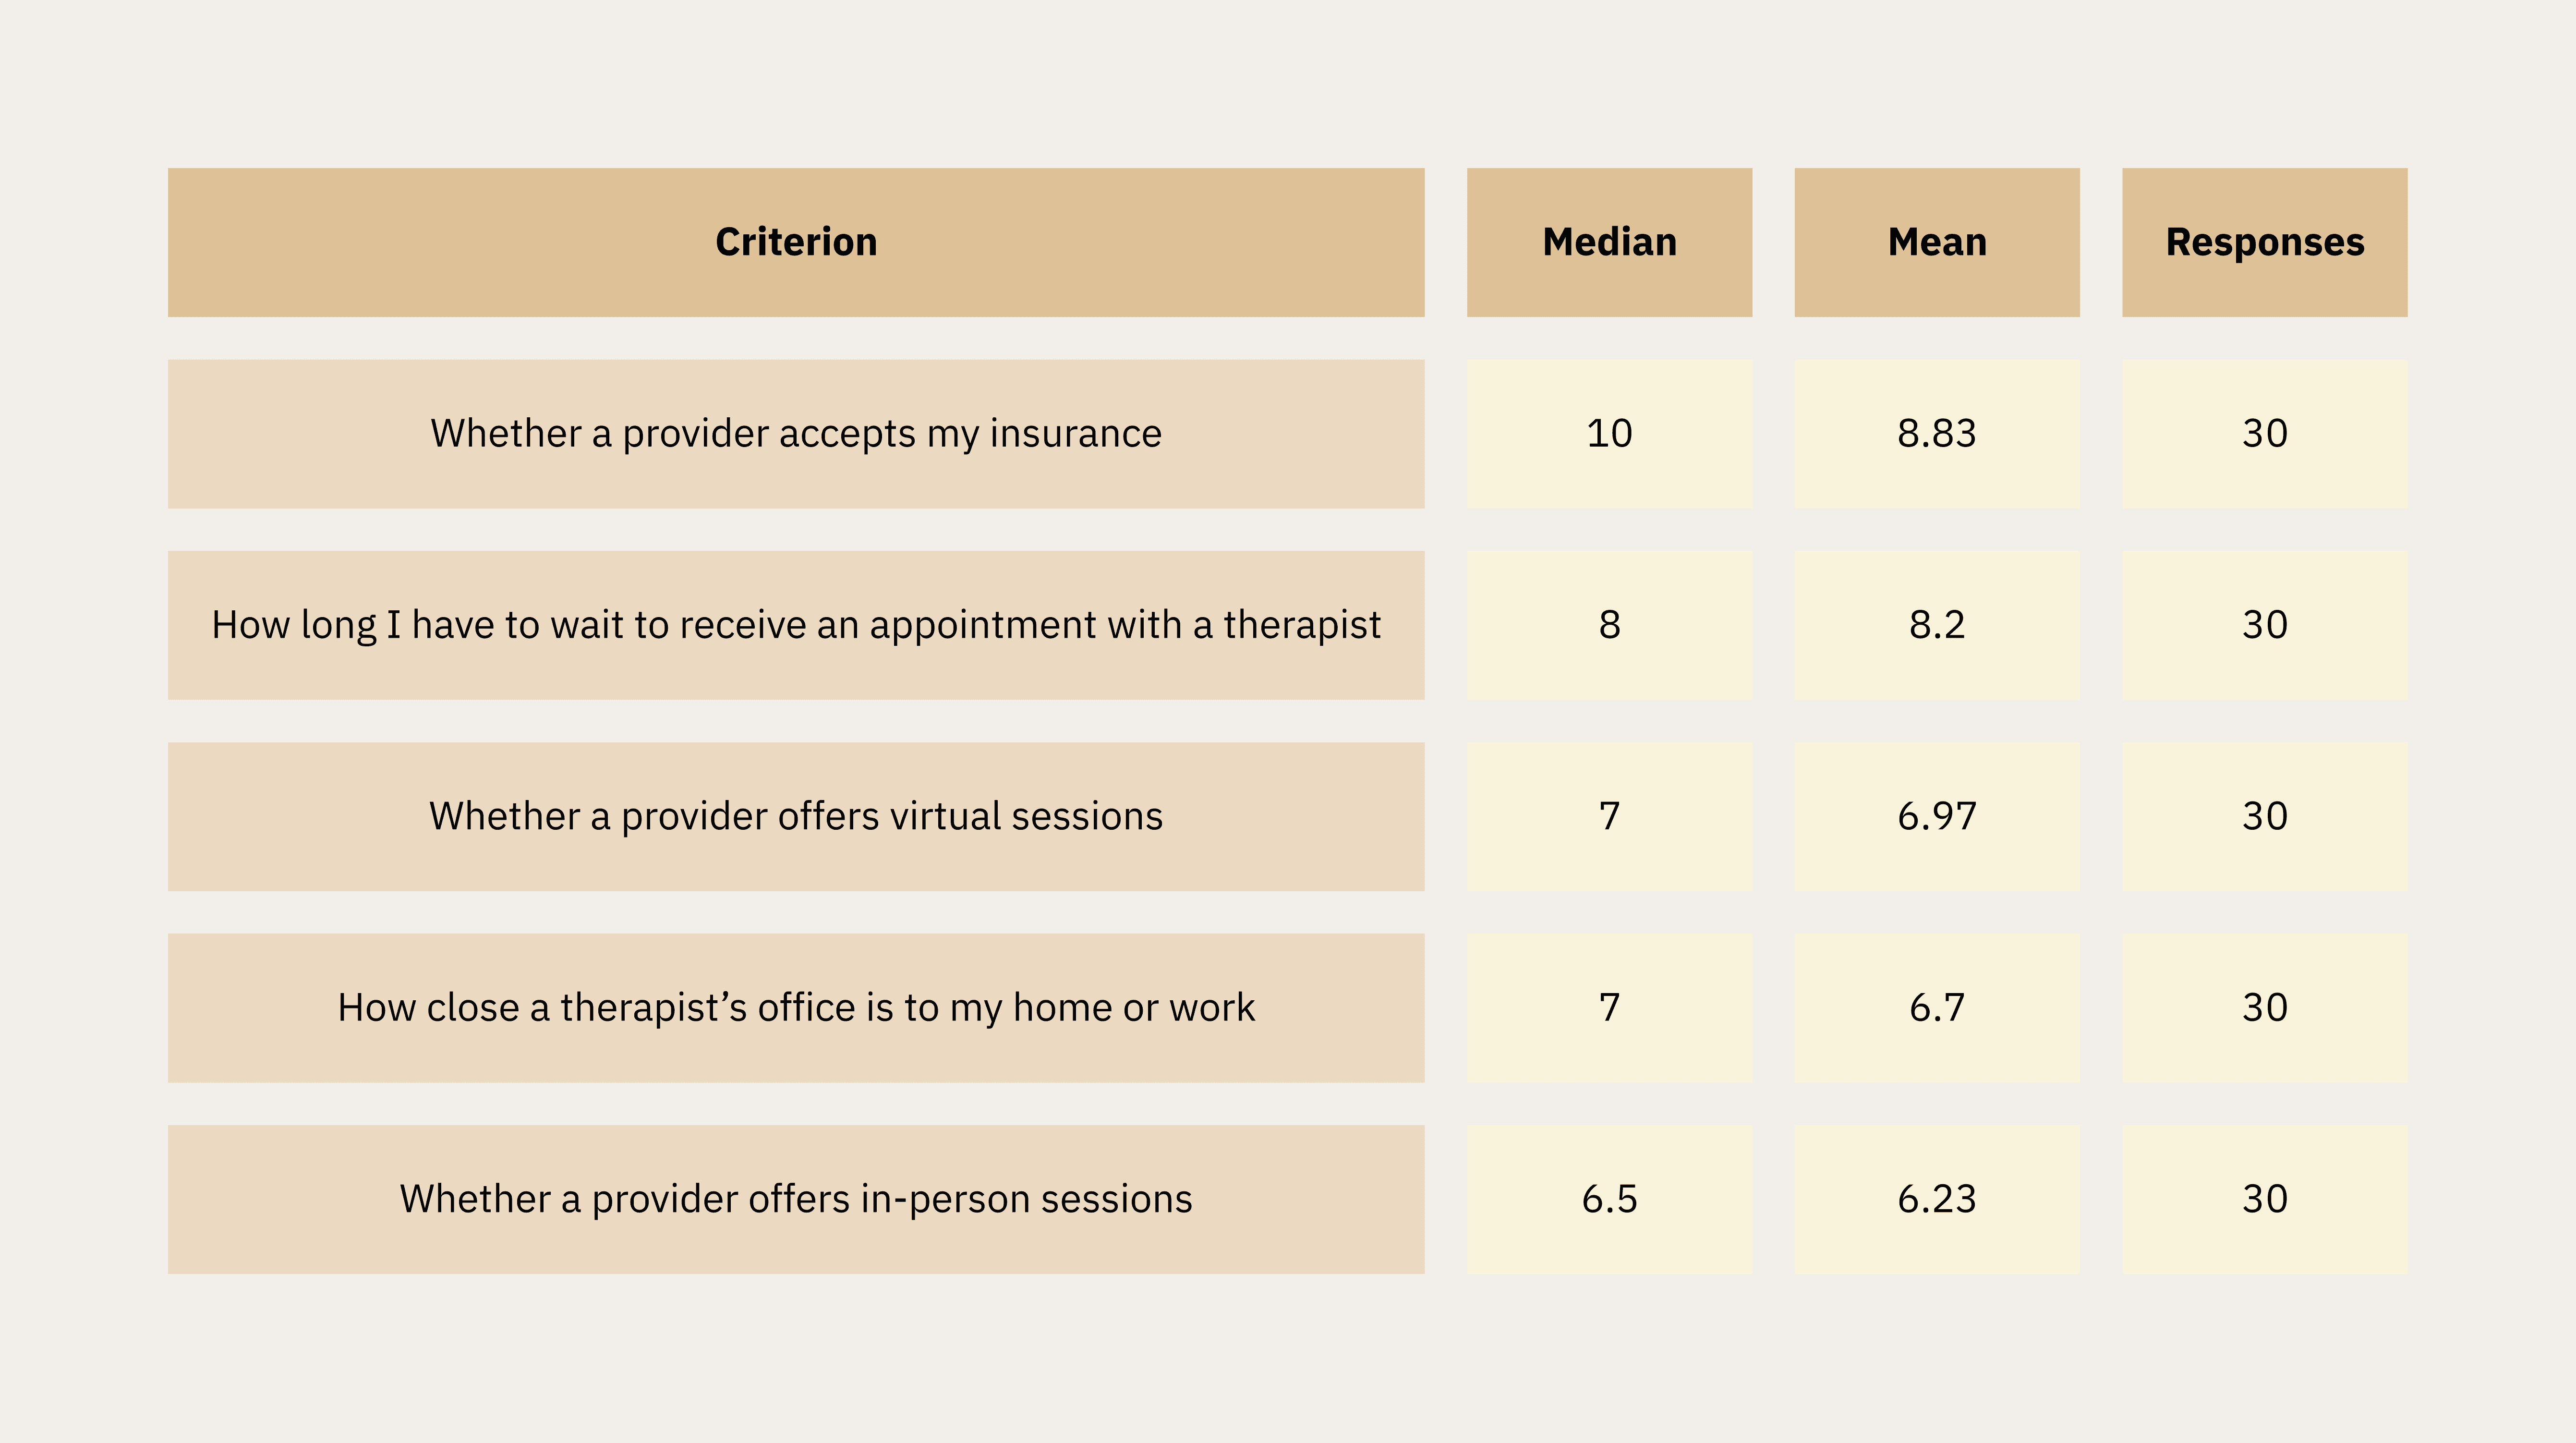
Convenience and Access Factors
Insurance acceptance was the single highest-rated criterion overall (median 10/10, mean 8.83). Wait time and virtual session availability followed closely.
Cultural Compatibility Factors
Comfort discussing physical health and disabilities ranked highest among cultural criteria. Comfort discussing LGBTQIA+ issues and cultural identity (BIPOC) were both rated with a median of 6–7, validating the qualitative findings on the importance of cultural fit.
Search and Filtering Features
The ability to search by condition/issue was the highest-rated feature (median 9/10). Scheduling online was also important to users, with a median 8.5, and ratings and reviews and connecting with a provider’s biography tied at median 8, confirming qualitative themes around scheduling friction and profile depth.
Biographies vs. Ratings & Reviews
Respondents showed a preference for biographies over ratings/reviews of therapists.
73% reported that they would be extremely likely to use biographies to help them decide, compared to 56.7% who reported that they would be extremely likely to use ratings and reviews (n=30).
What Makes Selecting a Therapist Online Difficult?
Therapist fit was the most commonly cited barrier to selection (13 respondents), followed by mental health literacy (9) and scheduling issues (8). This triangulated directly with the top themes from interviews.
What Would Stop You From Scheduling?
Therapist fit and scheduling issues topped the list of abandonment triggers, with money and insurance concerns close behind (9 respondents). Notably, mental health literacy — the #2 barrier to selection — ranked last as a scheduling barrier, suggesting literacy concerns dissipate once a user has narrowed their choice.
Preferred Scheduling Method
Online scheduling via website or app was preferred by 50% of respondents (15 of 30), outpacing email (8), phone (4), and text (3). This directly validated the qualitative finding that phone-based scheduling friction was a key pain point.
Design Implications & Feature Recommendations
Research findings were synthesized into a feature prioritization matrix for the WellMind platform, with each feature grounded in specific evidence from across all three research phases.
Feature | Priority | Research Basis |
|---|---|---|
Compatibility questionnaire | High | All three phases showed provider compatibility & cultural fit as paramount |
Enhanced provider profiles | High | 73% found biographies most helpful; qualitative data confirmed demand for transparency |
Real-time scheduling | High | 50% preferred online scheduling; scheduling friction was a top abandonment trigger |
Specialty verification | High | Specialization was highest-rated therapist preference criterion (median 9/10) |
Community forum | Medium | 90% used online resources vs. 50% professional advice — peer support in demand |
Credential glossary | Medium | Mental health literacy gap identified across interviews and confirmed in survey |
Reflections
Reflections
Limitations
Sample demographics skewed female (65.5% in survey) and toward a narrow age range (median: 27). Future research should recruit specifically across gender identities and wider age bands.
A longitudinal component tracking user behavior from initial search through treatment outcomes would add significant explanatory power.
Provider perspectives were not captured. Therapist experiences with current platforms would surface constraints invisible from the user side.
What This Project Demonstrated
End-to-end mixed-methods research design moving from exploratory to explanatory to validating phases
Rigorous qualitative coding using Atlas.ti with a codebook tracing every theme to its source
Collaborative synthesis at scale using Miro for affinity diagramming across 200+ data points
Quantitative hypothesis testing using Spearman’s correlation in R Studio, with correct selection of non-parametric methods for ordinal survey data
Ability to interpret a null statistical result as substantively meaningful — not a failure, but a key finding that reframed the design problem
Communicating complex mixed-methods findings in a form that directly informs product feature prioritization